How to Find The Best Dividend Stocks
Making dividend stocks part of your portfolio is one of the best ways to create wealth over the long-term. Dividend stocks show less volatility than the others as well as it's a great way to generate passive income.
But not all dividend stocks are reliable. Many fundamentally weak companies pay exceptionally high dividends and special dividends to their investors. But these dividends are not sustainable and are nothing more than a trap. So before investing in the dividend stocks, check the points given below to pick the crème de la crème of dividend stocks.
Want to learn more about dividend Investing? Check this article - Dividend Investing in 2020 - The Way to Wealth
Process for picking Best Dividend Stocks:
Dividend Yield
When it comes to dividend stocks, people first check the dividend yield. Many people follow the higher dividend yields and unknowingly end up in a trap.
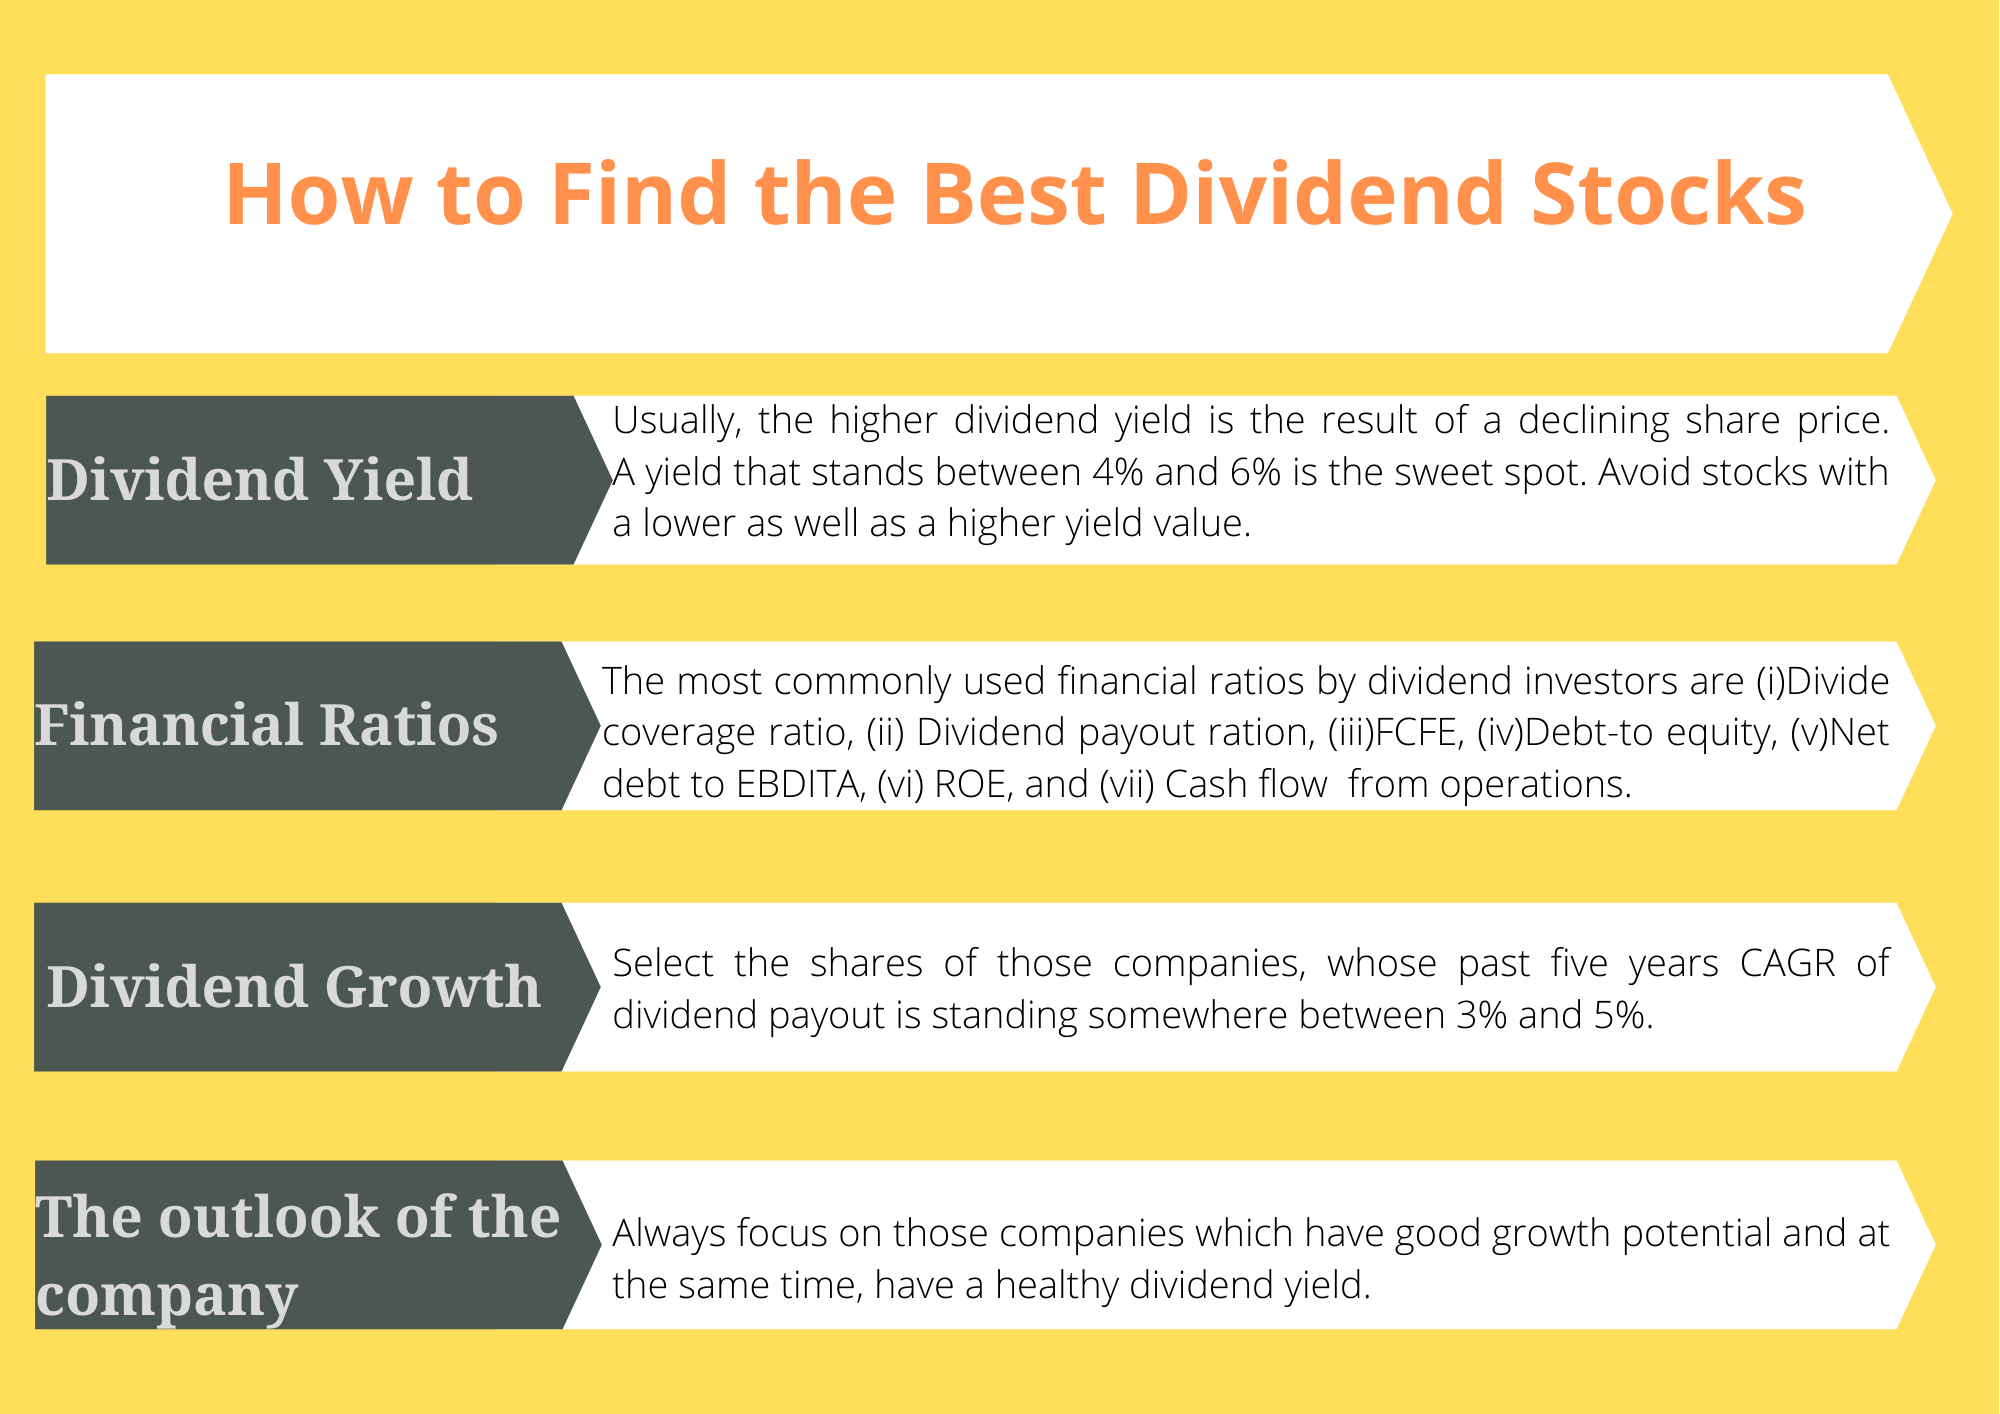
Usually, the higher dividend yield is the result of a declining share price. If the share price has fallen significantly in the recent past, then it implies an abrasion in the fundamentals of the company. Sooner or later, it'll hit the earning power of the company, and with a decline in the earnings, the company may either cut-down the dividend payout or it won't pay dividends at all.
Now you may be thinking about what is an optimum dividend yield. Usually, a yield that stands between 4% and 6% is the sweet spot. Yet, it depends mostly on market conditions. So a better way is to make a peer comparison. If it's in line with that of its peers, then it's a better choice. Always avoid stocks with a lower as well as a higher yield value.
Financial Ratios
Various financial ratios show the company's potential to pay future dividends. Share market wizards and analysts use these ratios to estimate the future dividend payouts of the companies.
The most commonly used financial ratios by dividend investors are:
- Dividend coverage ratio
The dividend coverage ratio shows how many times, in a particular fiscal, the company pays the dividend to its shareholders out of its income. It's the ratio between the net income of the company and the dividend paid to the shareholders. A higher value of the dividend coverage ratio is more attractive. - Dividend payout ratio (DPR)
The dividend payout ratio shows what percentage of the profit is paid out to the common shareholders as dividends. DPR is the ratio between the dividend per share and earnings per share (EPS).
A higher value of DPR shows that the company is paying out more money as dividends and investing back less in the business. But a too-high value (above 50%) of the dividend payout ratio is not preferable as it shows the company is growing slowly, and there is very little chance for the expansion of the business as well as market share. In the future, the company may struggle to maintain the current level of the dividend payout ratio.
On the other hand, a lower dividend payout ratio implies that the company is investing back a large portion of its profit in the business. The companies whose growth is in the fast track report a lower dividend payout ratio as they invest back a large part of the profit in the business for expansion and innovation. Chances are more that these companies may produce higher capital gains in the future.
The dividend payout ratio varies from industry to industry. So don't forget to compare it with its peers or with the industry average. - Free cash flow to equity (FCFE)
Free cash flow to equity shows how much money left with the company after meeting all expenses, or in other words, it's the amount of cash available to be distributed to the shareholders. If the company is paying dividends in the absence of free cash flow, then that won't sustain in the long run. The company should pay all the dividends from FCFE. - Debt-to-Equity
Debt to equity measures the company's use of fixed-cost financing sources. Increases and decreases in this ratio show a higher or lesser dependency of the firm on debt as a source of financing.
A higher value of debt to equity indicates a probable reduction of dividend payout, and the chances are high that the company may not pay the dividend for a while to pay off the debts. - Net debt to EBDITA
Net debt to EBDITA shows how many years the firm will take to pay off its debt if net debt and EBDITA are held constant. A lower value of net debt to EBDITA is attractive as it shows the company will be able to repay its obligations soon.
A higher value of net debt to EBDITA (above 5) shows a higher debt level and a higher probability that the company will default its obligations. Subsequently, there may be an erosion in the share price as well as the company may not give dividends in the future.
The value of net debt to EBDITA varies from industry to industry. So, either a peer group comparison or a comparison with the industry average will show a clear picture. - Return on Equity (ROE)
Return on equity indicates the company's ability to generate profits on the shareholders' money invested in the business for a long period of time, or in other words, it shows the company's ability to convert the asset into profits. A consistent history of ROE shows that the company can survive long and can generate a good amount of profit for the long-term. - Cash flow from operation
Cash flow from operation or operating cash flow shows the volume of cash that the company generated from its business. It doesn't include the cash flow from investing and financing activities. Before investing in the shares, make sure that the company is creating a consistent and healthy cash flow from operation. It implies how stable the operations of the company are.
Divided growth
The best dividend stocks always have a strong dividend history, and their dividend payout increases steadily over the years. So before investing in the shares of any company, check its dividend growth rate. Either if the firm's dividend growth rate is stagnant or if there is a decline in it, then don't go for its shares. Select the shares of those companies, whose past five years CAGR of dividend payout is standing somewhere between 3% and 5%.
The outlook of the company
Avoid those companies that rely on obsolete technologies and that are not adapting to the change in the customers' interests. These companies are slowly making their place in the pages of history. So, don't get in the trap of their past performance. Also, avoid the share of the companies that have a cyclical business as, during the downward cycle, they may reduce to a dime.
Always focus on those companies which have good growth potential and at the same time, have a healthy dividend yield.
The bottom line
No doubt that dividend investing is a great investing strategy. But, like in any other approach, the investor should do proper research on the fundamentals of the company in dividend investment as well. As Warren Buffet once said, "Never depend on a single income. Make investment to create a second source." Investing in dividend stocks is like creating a third source as well.
Tags: How to Invest in Dividend Stocks, Best dividend stocks for passive income, How to find best income stocks