Top 12 Investing Basics Stock Simulators Can Teach You
Benefits of using stock market simulators
The world’s greatest and most successful investor of all time, Warren Buffet, has started his investment journey at a very young age, even before he was a teenager.
Today, he is an inspiration to the large population of investors spread across the world.
His story is not about quick money-making; instead, it’s all about saving money and investing it in a disciplined manner.
His strategies are not hidden; instead, they are widely discussed and proven.
With discipline and keen interest, anyone can be successful in the stock market.
A stock simulator is merely a platform that teaches you about these strategies and makes you strong to face the challenges of the real-stock market. Hence, here are few points which you can use as the foundation stones in your journey to become a millionaire.
12 Basic Things Stock Simulators Can Teach you -
- Stock Research
- Stock Graphs Reading
- Day Trading
- Advanced Trading (Limit / Stop) Orders
- Managing Your Portfolio
- Makes You Better Investor
- Increases Your Financial Knowledge
- Helps to Learn Algorithamic Trading
- Helps to Learn Crypto Currency trading
- To Control Emotions while Investing
- Gives Good Overview of Stock Market
- Compare Yourself With Others
See Top Strategies that can lead you towards higher returns on Stock Market
How to do Stock Research / How to Find Good Companies
“If the job has been correctly done when a common stock is purchased, the time to sell it’s almost never.” – Philip Fisher, an American stock investor and author.
Before going on a hunt for good companies on different available sites, just think about what in this earth can fascinate you.
It may be food, fashion, movies, etc. If you are foodie, then there are lots of food and beverage companies as well as restaurants to follow. They are Coca Cola, McDonald’s, Starbucks, Krispy Kreme, etc.
Then if you’re a fashion freak, focus on retailers. In short, focus on those companies, whose business you can understand very easily.
If you stick to the companies of your interest, then you’re accelerating your journey to become a millionaire.
Many have failed at the first point itself because they bought the shares of those companies which they hardly heard about and whose business they couldn’t understand.
Never buy shares of someone else’s choices, instead, stick to your choices. If you’re confused about your interests, then just open the door of your cupboard and check which company manufactured the products kept in it. Follow those companies.
After selecting the companies, find the ticker symbol of these companies. Some of these companies may be doing well while the business of some may in the troubled waters.
Avoid those, which are not doing well as investing in them may cost you a lot.
The next step is making them part of your watch-list and track their price moves.
Having a watch will help you in many ways. First of all, it’ll help you to remember the companies even if you’re not investing in it.
Next, it’ll help you to see how it reacts on news both good as well as bad. The foremost, you’ll get a good idea about the business not only about that company but about its peers and the industry it belongs.
Reading and understanding the income statements and balance sheet also a part of knowing the business.
Thus keeping a watch list will help you to increase your financial knowledge also.
How to Read Stock Graphs and Charts
“Technical analysis is a skill that improves with experience and study. Always be a student and keep learning.” - John J. Murphy, an American technical analyst as well as an author.
Chart patterns represent the behavior of the masses.
The art of reading charts is called technical analysis.
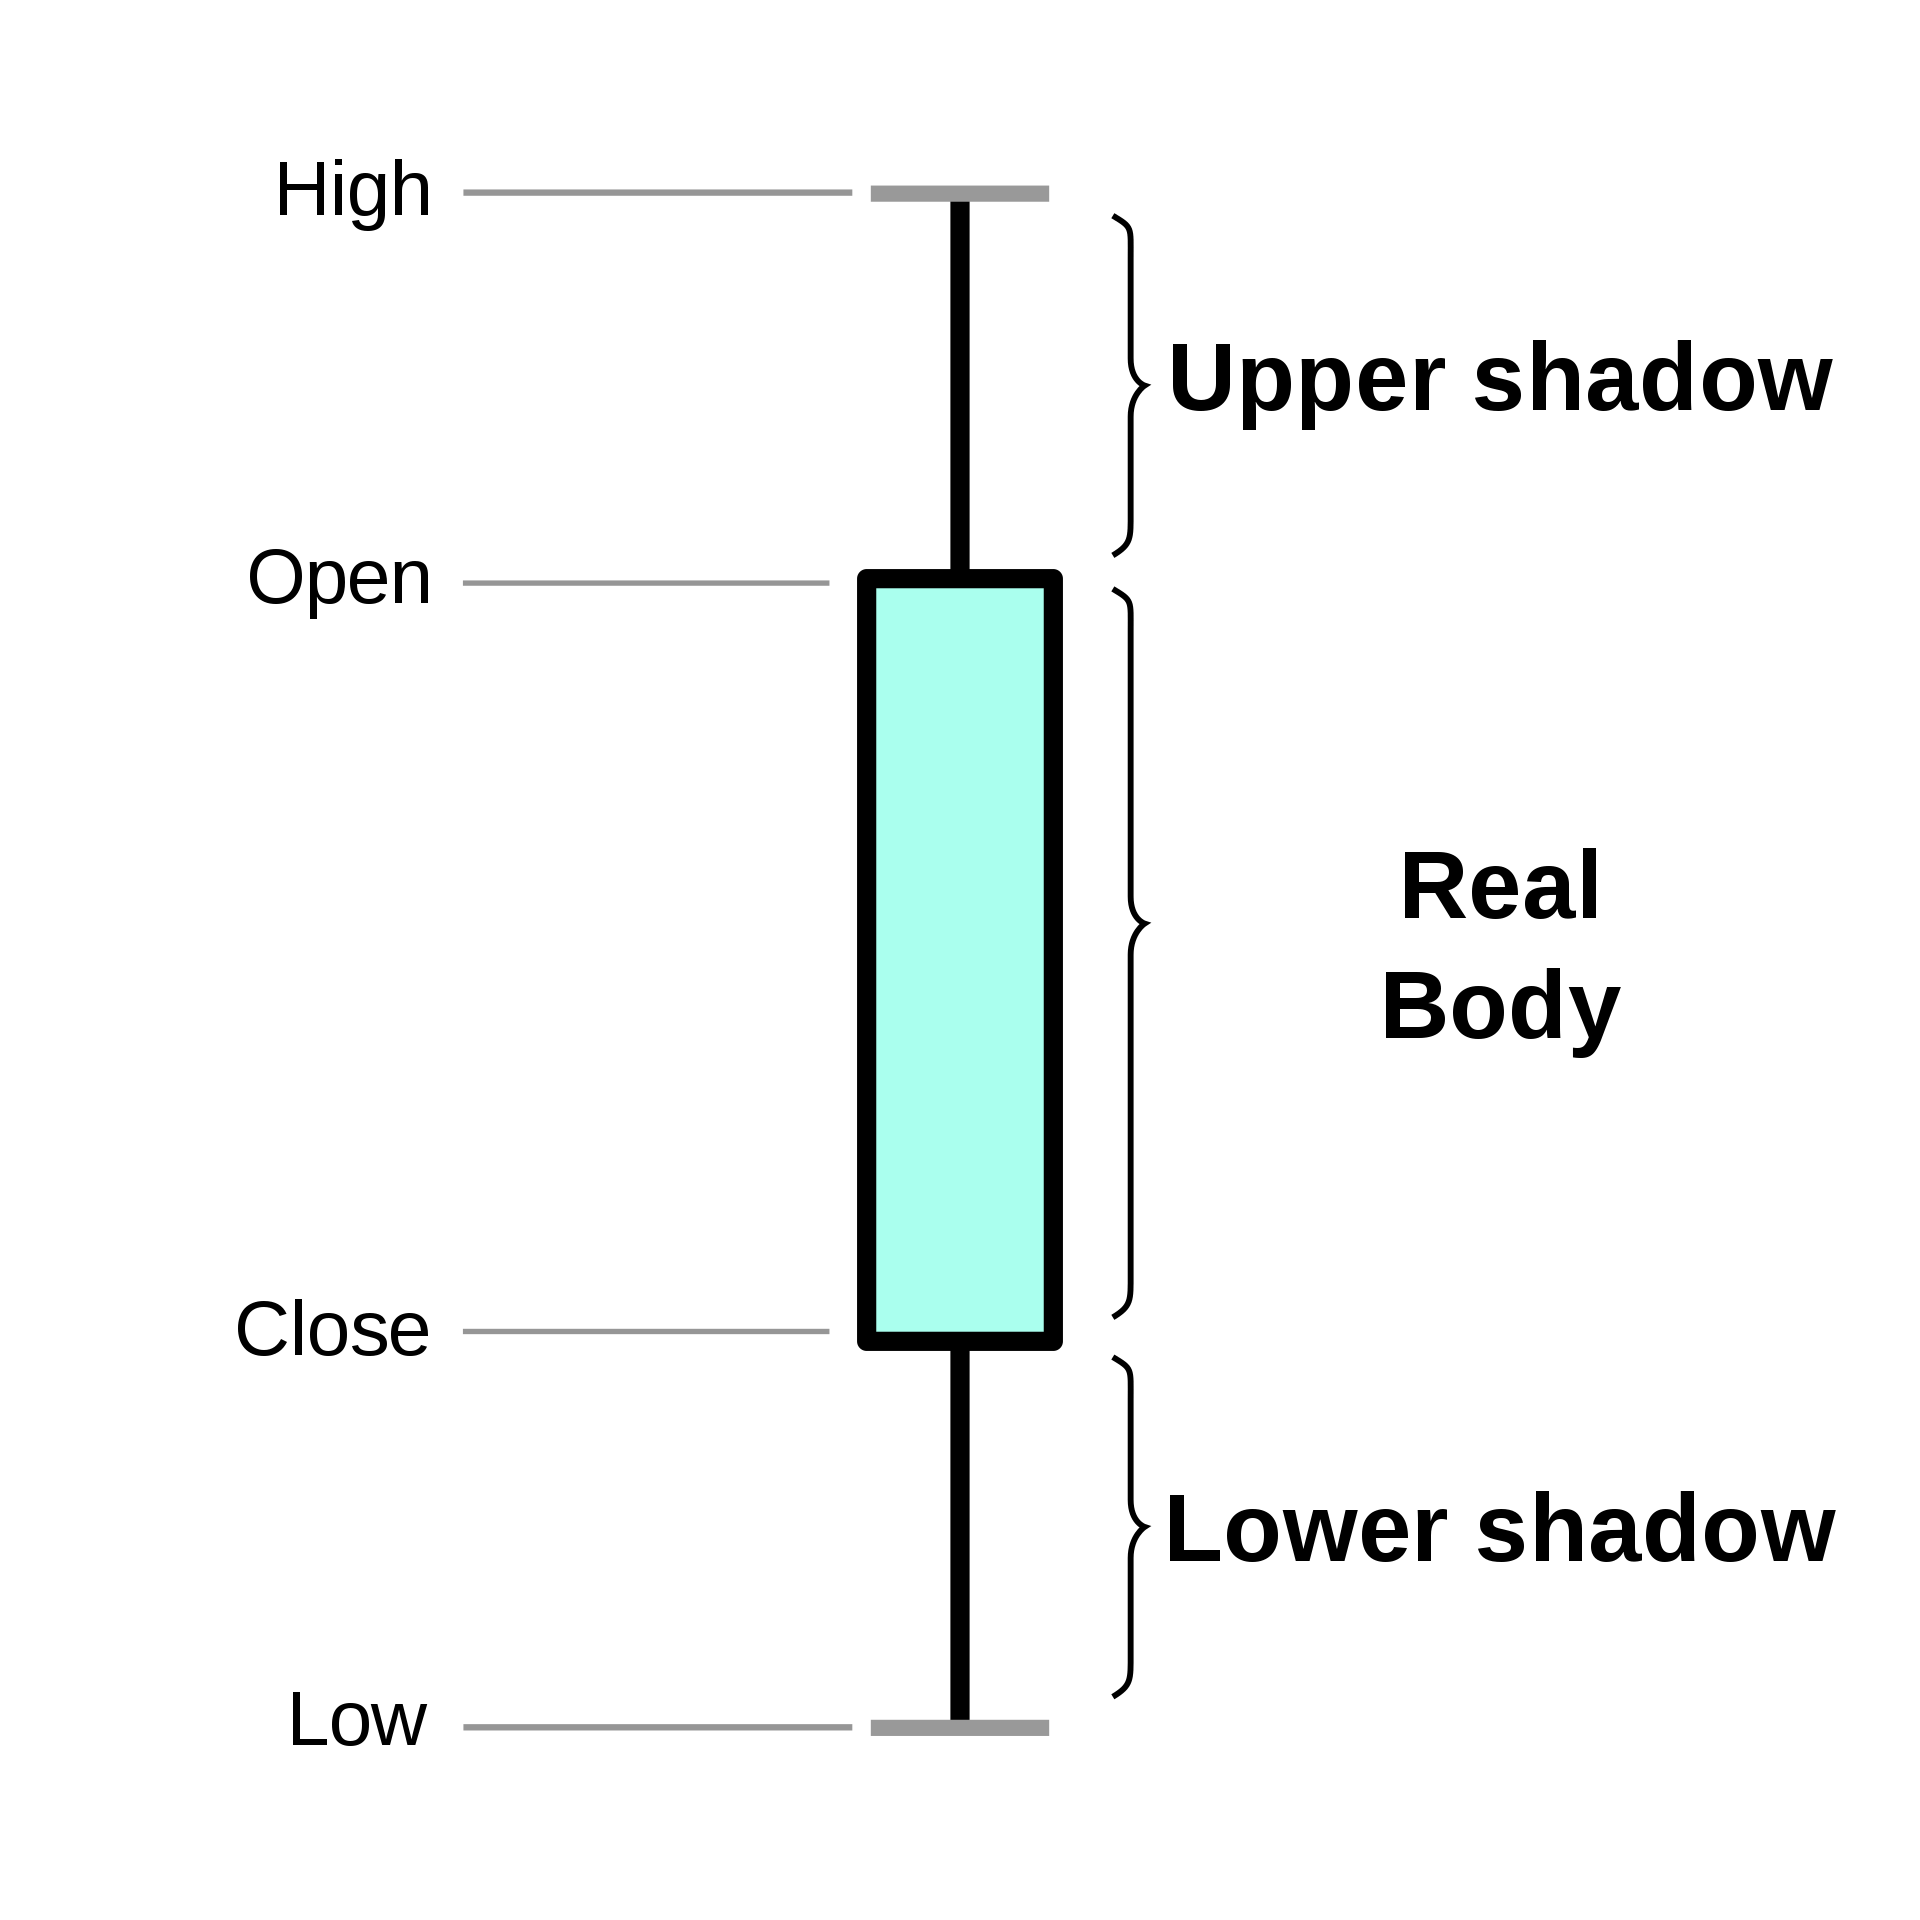
Chart reading is mainly concerned with price and volume data. There are various types of charts like bar, line, candlestick, etc.
They differ in their looks but show the same information for a particular period for a selected stock.
Among the various types of charts, bar charts are most commonly used.
A bar has three components- an opening foot , a closing foot , and a vertical line. Each bar has will show open, high, low and close price of each minute or day depend on the selected range.
Support and resistance are nothing but price levels at which the price stops going up or down.
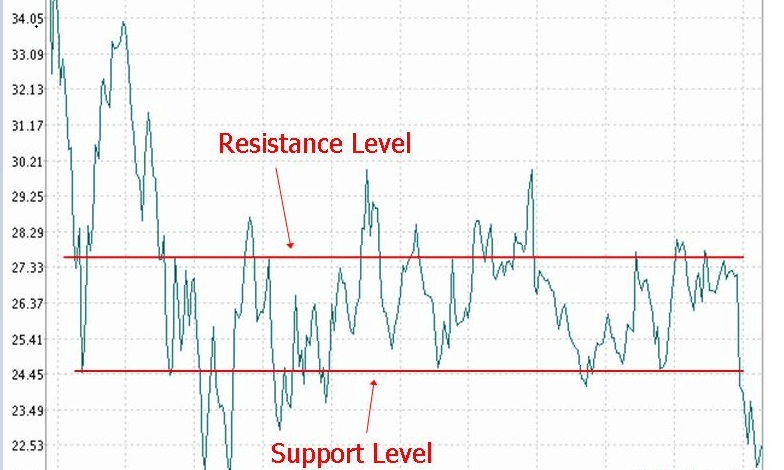
If bulls think that the price is low, they try to buy and due to the strong demand, the price will move up.
When the price starts rising, the bulls become less aggressive and the bear becomes more aggressive.
At some point, this aggressiveness will balance and that price level becomes resistance.
On the other hand, when the aggressiveness of the bear falls, that of the bull rises and the point at which they balance is called support.
All markets remember the previous support and resistance levels, which can be used as target or limit prices when the markets have traded away from them i.e. if a rally ended before a year ago, the top of the rally becomes resistance for the next rally.
Breakout
Breakout is another important term in technical analysis. A breakout occurs when prices surpass either the support or resistance as a result of a market event or news. In such a circumstance, if the bulls get aggressive, then the market will start moving up and vice-versa.
Volume
Volume shows the number of shares traded at a particular time.
Volume lines are displayed at the bottom of the chart and it shows the interest level in a stock.
Longer the line, higher will be the volume. It also tells how liquid the stock is.
Suppose the stock is trading at a high volume for a long period, this implies that the stock is liquid.
When we combine the price with the volume, it becomes more meaningful.
If the price rises with an increase in the volume, then it shows a positive trend.
Many times you can see an increase in the volume before a significant move in a stock.
This is called interest building and implies a significant move to come in the stock.
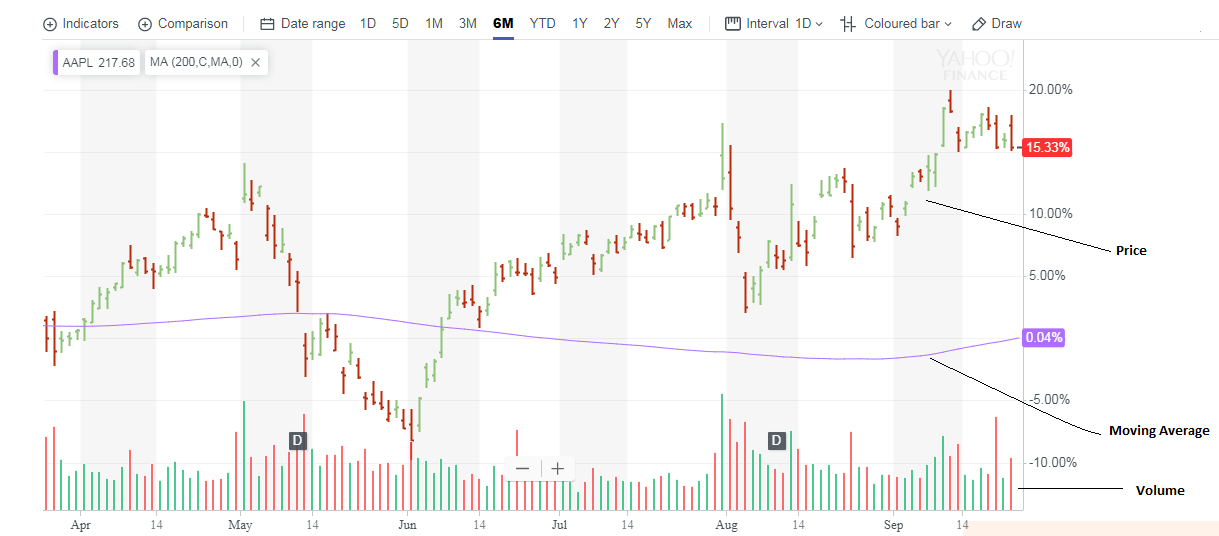
Moving Average
Moving average is the average price of a stock or market over a defined period. A 200-day moving average is used to determine the long-term trend.
Price Momentum
Price momentum measures the speed and force of the trend.
Overbought and oversold are two terms associated with momentum which suggests that too much stock has been bought or sold.
They mean that the market has moved too far, too fast and the trend can’t be sustained.
Six-month price chart of Apple Inc. is given below:
How to do Day Trading
If the holding period of a stock is one day or less than that, it is called day trading or intraday trading.
It aims to gain profit by taking advantage of price momentum.
Here, strong planning is required to identify which stock you’re going to trade in; when you’re going to trade it; and the strategies you’re going to follow.
Practice of several months on a simulator will make you perfect for this.
To start with day trading, make a watchlist of the stocks and follow them with the help of charts.
Always try to select volatile stocks for day trading. The first two hours of the trading is considered as the best time for trading as it’s the most volatile time of the day in which there will be big moves in the price which you can convert into profit.
Cut your losses with the help of stock orders. Each day and every trade is a lesson. Learn from them.
How to put Advanced Trade Types (Limits / Stops)
Limit orders and stops orders are two widely used stock orders used to buy/sell the stock at the best price.
The Limit order is helpful when the market is volatile. It helps the buyer not to buy a stock beyond a price and at the same time, helps the seller not to sell a stock below a specific price.
On the other hand, the stop order is a conditional limit order because it is activated only when the market price of the security reaches or crosses a threshold specified by the investor.
How to Manage your Portfolio
“Falling in love with stocks in a portfolio is very easy to do and, I might add, very perilous.” – John Neff, an American investor, mutual fund manager and philanthropist.
A portfolio is nothing but a selection of different asset classes like stocks, bonds, mutual funds, etc.
But a simulated portfolio can be a selection of companies of different sectors like IT, Auto, Banks, Pharma, etc. thus you can spread the risk. Investing in index stocks is the best strategy to diversify your portfolio.
Portfolio in a simulator will help you to track the details like the date of purchase, how many shares were bought at what price, how much commission you paid for acquiring these stocks and your total acquisition cost.
It’ll also help you to identify which stock is taking your portfolio value up and which one is dragging it down, thus you can react on time for cutting your losses or for booking your profits.
Simulators like TradingKart will help you to learn all of these techniques without losing your actual money.
After making a portfolio, its periodic review is highly recommended.
It Makes you a better Investor
There are various ways to invest your money in the stock market and a simulator will help you in mastering all these techniques before you test your trading abilities in the real-system.
Few famous investing strategies are:
Value Investing
A value investor will always look for companies that are undervalued relative to the market.
They concentrate more on the price and buy the stocks which they think are bargains. Value investing will help you to find the shares of a strong company at a low price.
Growth Investing
This strategy concentrates more on growth. Growth investors will be ready to buy the shares even at a higher price because they think the company has great potential to grow.
Buy the Dip
When the price of the stock falls from its peak, the investors see it as an opportunity to buy that particular stock as they think it has the potential to go back to its previous high.
Buy-and-Hold Investing
It’s the decision of the investor that how long she/he wants to hold it. Warren Buffet once said that “My favorite time frame for holding a stock is forever.”
But there is no meaning in holding those stocks forever that are not showing a good upside sign for a long period of time.
Dollar-Cost Averaging
Investing regularly the same amount of money in one or more stocks is called Dollar-Cost averaging.
This strategy will not only help to protect you against the volatility but also help to develop a disciplined investment nature in you.
It increases your Financial Knowledge
The news section in a simulator will give you the latest updates of the corporate world, economy, and personal finance.
This information will help you to make strategies for the day. In many simulators you’ll find a dictionary which tells the meaning of various financial terms you may often come across.
Some even give the basics of fundamental analysis as well as technical analysis. Fundamental analysis will tell you whether to enter or exit in a stock while technical analysis will show you when to enter and when to exit.
It helps you to learn about Algorithmic Trading
Algorithmic Trading, also known as automated trading, use programs and high-speed computers to execute a very large volume of orders and it makes sure that stocks are trading at the best possible price.
It not only reduces the transaction costs but also manual errors in placing the trades.
It helps to book profit quickly, out-of small price changes. When you use a platform supported by AT for the first time in real-world that too without practicing it in a simulator, then there are higher chances to make mistakes due to its high speed and unique features which are challenging for human abilities to accomplish effectively.
Here, strategies are different from that of the discretionary trading. Various strategies used in algorithmic trading are:
- Momentum and trend based strategies (follow trends in various technical indicators)
- Arbitrage opportunities (buying at one market and selling in another market at a higher price thereby taking the advantage of the price difference)
- Weighted average price strategy (large order are divided in small parts using either historical volumes or time slot)
- Mean revision strategy (based on the concept that the price may go high or low, but they come back to average or mean value at some point of time).
It helps you to learn Cryptocurrency Trading
Trading in cryptocurrency, the fastest growing virtual asset, is much more volatile than the normal stocks.
The most famous crypto currency is Bitcoin and the other few famous ones are Ethereum, Ripple, Litecoin etc.
The only technical indicator used in Bitcoin trading is On Balance Volume (OBV) – a combination of volume and price- which indicates the total money transacted (both in and out).
For a particular period of time, if Bitcoin is moving up and OBV is trading down, then it shows a selling is about to come or in other words, the uptrend is not going to sustain for long time.
Various simulators available for trading cryptocurrency are Bitcoin Mining Profit Calculator, Bitcoin Hero, Altcoin Fantasy, CoinMarketGame, etc.
The website of these simulators will allow you to create a portfolio, which will look like the picture given below.
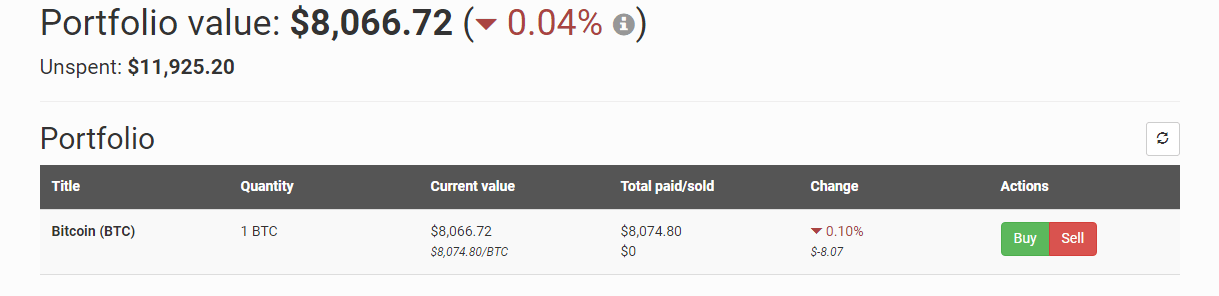
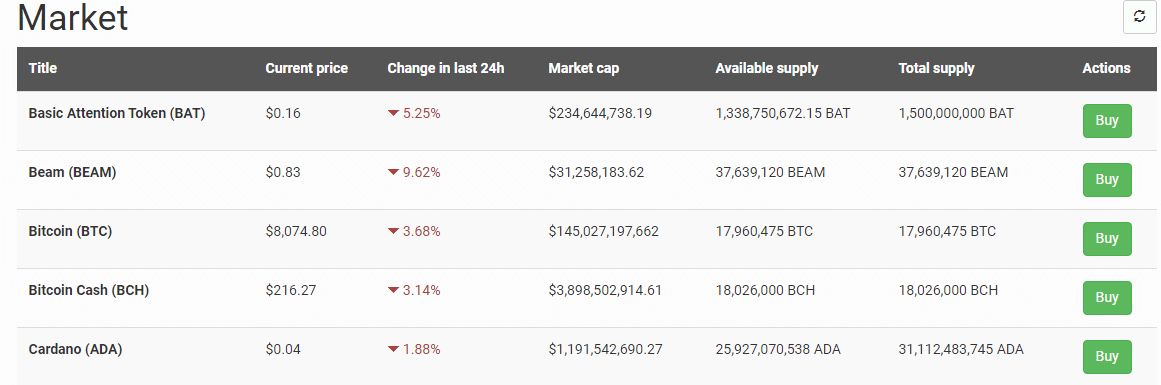
Under the Market option, you’ll be able to find different cryptocurrencies which are ready to trade.
The Leaderboard shows the details about the winners with whom you can compare.
It teaches you to control your emotions while Investing
“Be fearful when others are greedy and greedy when others are fearful”
- Warren Buffet
The art of investing depends a lot on your psychology. As an investor, you should know when to buy a stock and when to book profits.
Some people get attached to certain stocks in such a manner that they won’t feel like selling them. But these types of decisions will ruin your investment journey.
A simulator will educate you about the investment process and a knowledgeable investor makes fewer mistakes based on emotions.
Emotions can drive you to bad financial decisions.
It gives a good overview of the overall Stock Market
A simulator can give you all the experience that a real-trading platform gives, that too without losing money.
Here you can test-out all your strategies, do stock picking, making and tracking the portfolio, putting stock orders, etc.
It’ll help you to check whether your strategies are working or not and also how you react when the market moves in the opposite direction of your strategies.
It can compare you with others so that you can check yourself with others
There are contests available in simulators. You can participate in these contests to check how sharp your strategies are in comparison with the others.
Playing these contests with friends will help you to have good time and fun. In the discussion group, you can discuss strategies with like-minded people.
Conclusion
As we have reached the end of this article, we hope that you have got an idea about the bright side of simulators and benefits of using stock simulators.
Think about your fascinations, learn about them, plan and pursue them. Take the help of a simulator like TradingKart to learn how to walk smoothly through the streets of stock market.
At a very young age, you can find your name on the millionaires’ list.
See - List of Best Stock Market Simulators