Best ESG Funds (Mutual Funds & ETFs)
Funds that focus on Environmental, Social, and Governance (ESG) factors are in high demand, and there are enough shreds of evidence that ESG investing is steadily gaining ground in the investment arena.
The aggregate sum invested in ESG was slightly more than $30 trillion at the end of 2018 (third consecutive year of record flow into sustainable funds), and this figure is expected to cross $50 trillion within the next couple of decades. But more than 70% of the investments in ESG are from institutions, and the retailer investors and HNIs together hold only a small chunk.
As a new generation sparked by the ideas of Greta Thunberg, Gen Z, is all set to foray into the workforce in this decade, we expect further changes in the investment approaches as well, an approach craving for sustainability.
With the population getting busier day after day, analyzing individual companies seems a little bit difficult task. At this point, ESG funds help to create wealth through responsible investments.
What is an ESG Fund?
An ESG Mutual Fund invests either in bonds or in the shares of the companies that have a high ESG rating/sustainability score.
The companies that pollute the environment or those give the least importance to the interests of employees and shareholders have no place in the portfolio ESG funds.
ESG factors help to find the risks resting below the businesses of the companies and the loopholes in their policies. At the same time, it helps to make the best-informed investment decisions. So these sustainable funds have given better returns than their non-sustainable counterparts.
ESG ETFs or Socially responsible ETFs hold $20.11b assets under management with an average expense ratio of 0.41%. They invest in equities, commodities, or fixed income.
Popular Stocks For ESG Funds
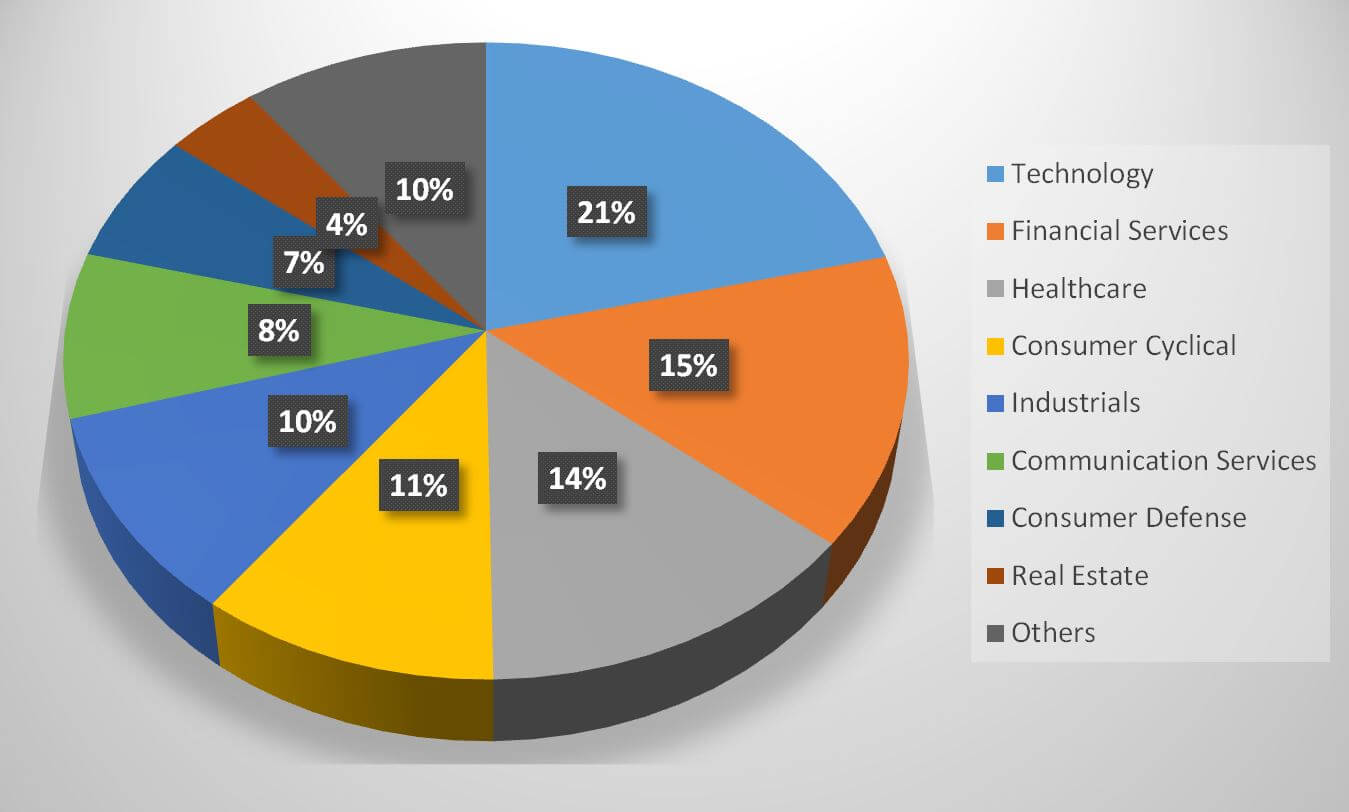
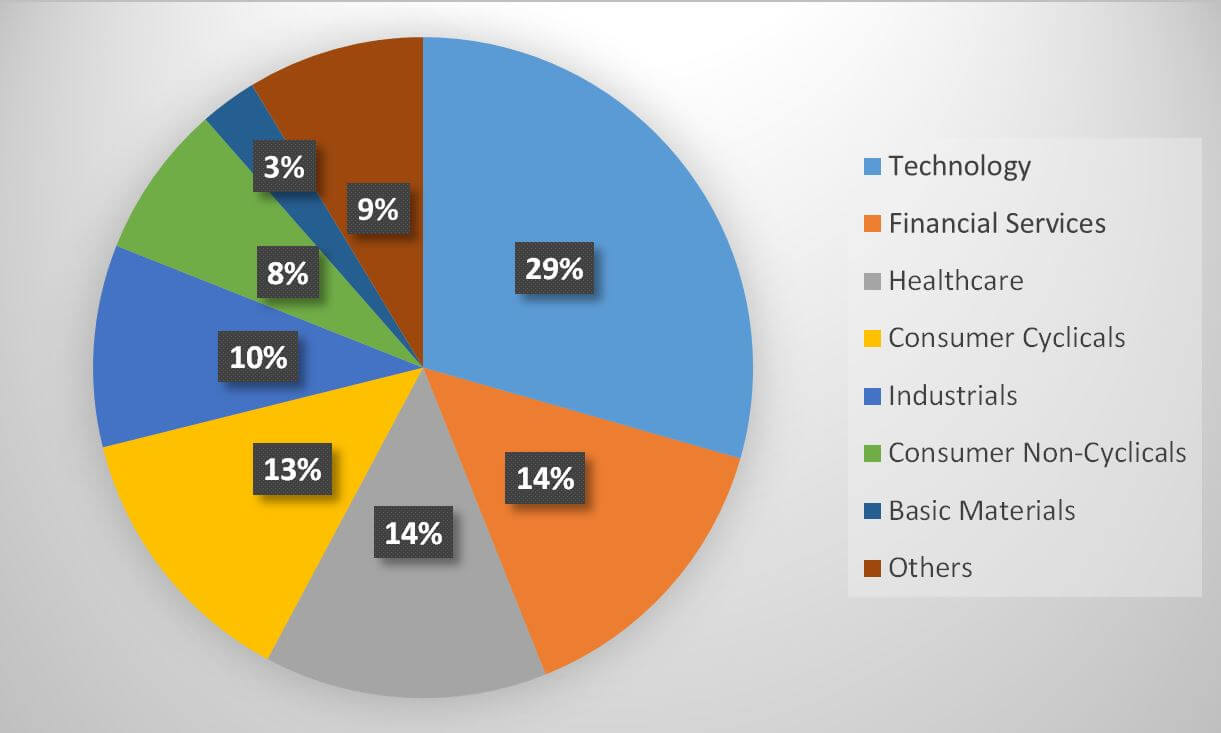
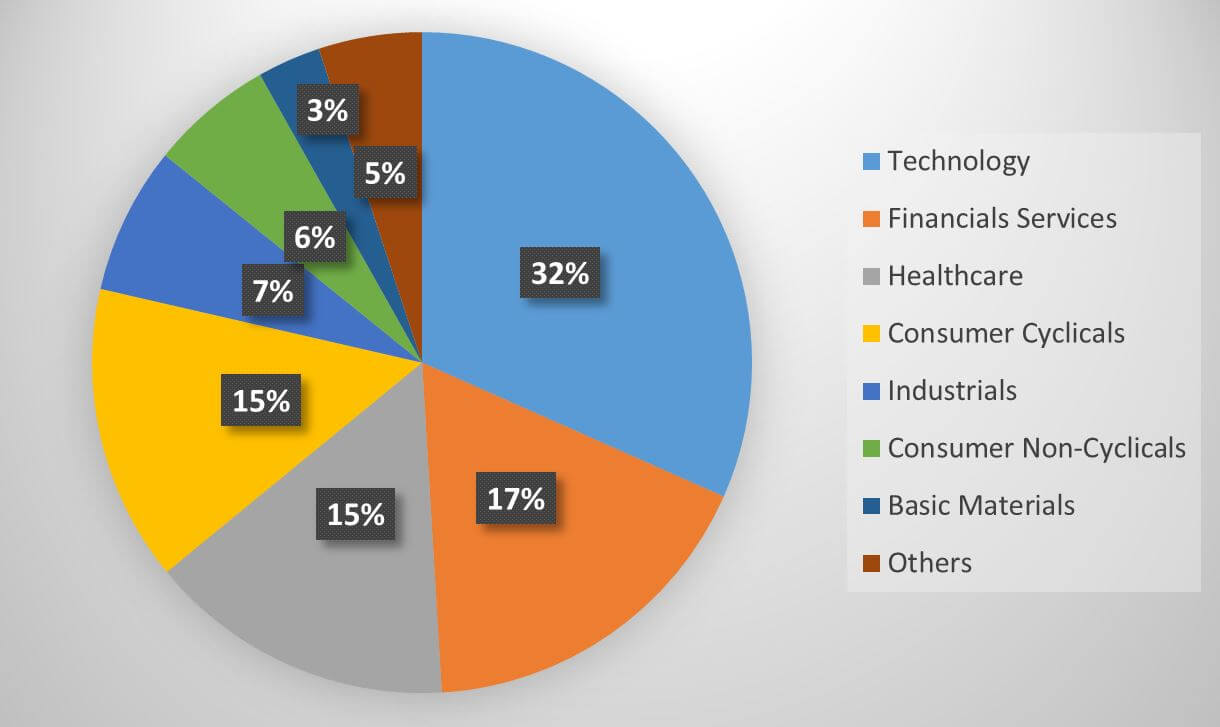
ESG funds pick crème de la crème of the ESG companies whose shares show less volatility. A portfolio analysis of various ESG funds shows that they invest heavily in technology companies, followed by those in the financial services and healthcare.
They stay away from the players of the sectors like energy, utility, gambling, brewing, tobacco, etc.
Apple (AAPL) is the apple in the eye of the most ESG funds (equity). The top picks of the ESG funds are -
- Apple (AAPL)
- Microsoft Corp (MSF)
- Alphabet Inc. (GOOGL),
- Amazon (AMZN)
- JP Morgan Chase & Co (JPM)
- Mastercard (MA), etc.
Top ESG Mutual Funds
Below are the top ESG Mutual Funds -
- TIAA-CREF Social Choice Equity Fund Institutional Class (TISCX)
- Vanguard Global ESG Select Stock Fund (VESGX)
- TIAA-CREF Social Choice Bond Funds (TSBIX)
- DFA Emerging Markets Social Core Portfolio (DFESX)
- PAX ESG Beta Quality Fund (PXWGX)
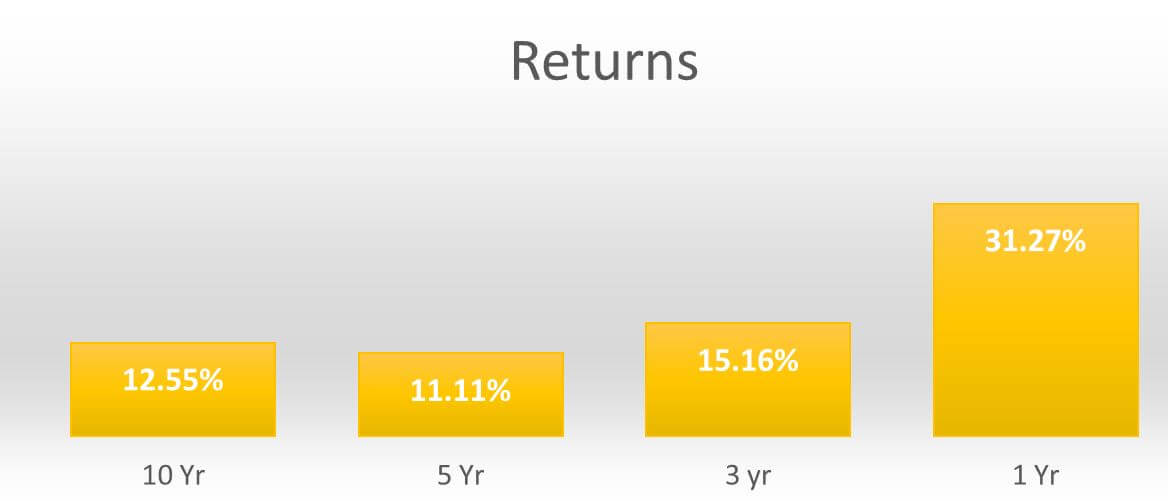
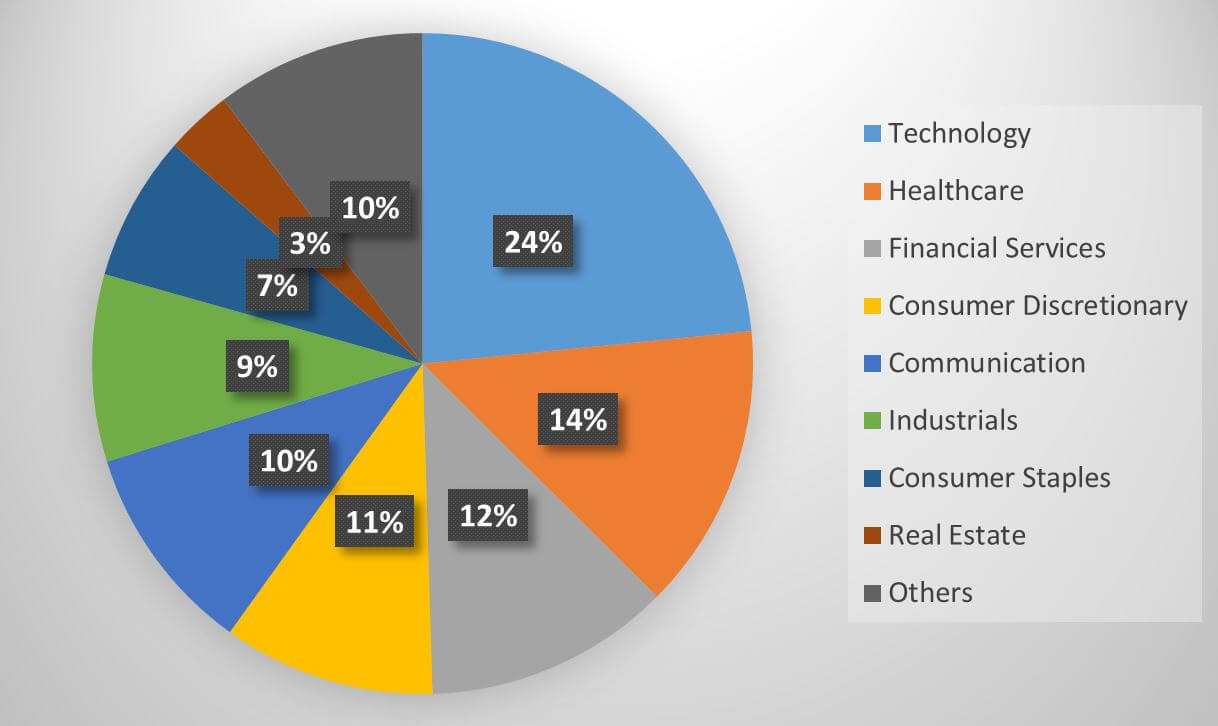
TIAA-CREF Social Choice Equity Fund Institutional Class (TISCX)
TISCX invests in those companies of the Russell 3000®Index that consider specific criteria of ESG. Usually, it invests 80% of its assets in equity. TISCX is suitable for long-term investors.
Profile:
|
Asset Class |
U.S. large-cap Blend Equity |
|
Fund Type |
Open End |
|
Inception Date |
1-Jun-99 |
|
Total Net Asser ($ Billion) |
4.99 |
|
Expense Ratio (%) |
0.17 |
|
YTD Return (%) |
1 |
|
Net Asset In Top 10 ($ Million) |
975 |
|
Holdings in Top 10 (%) |
20.09 |
|
Benchmark |
Russell 3000 TR USD |
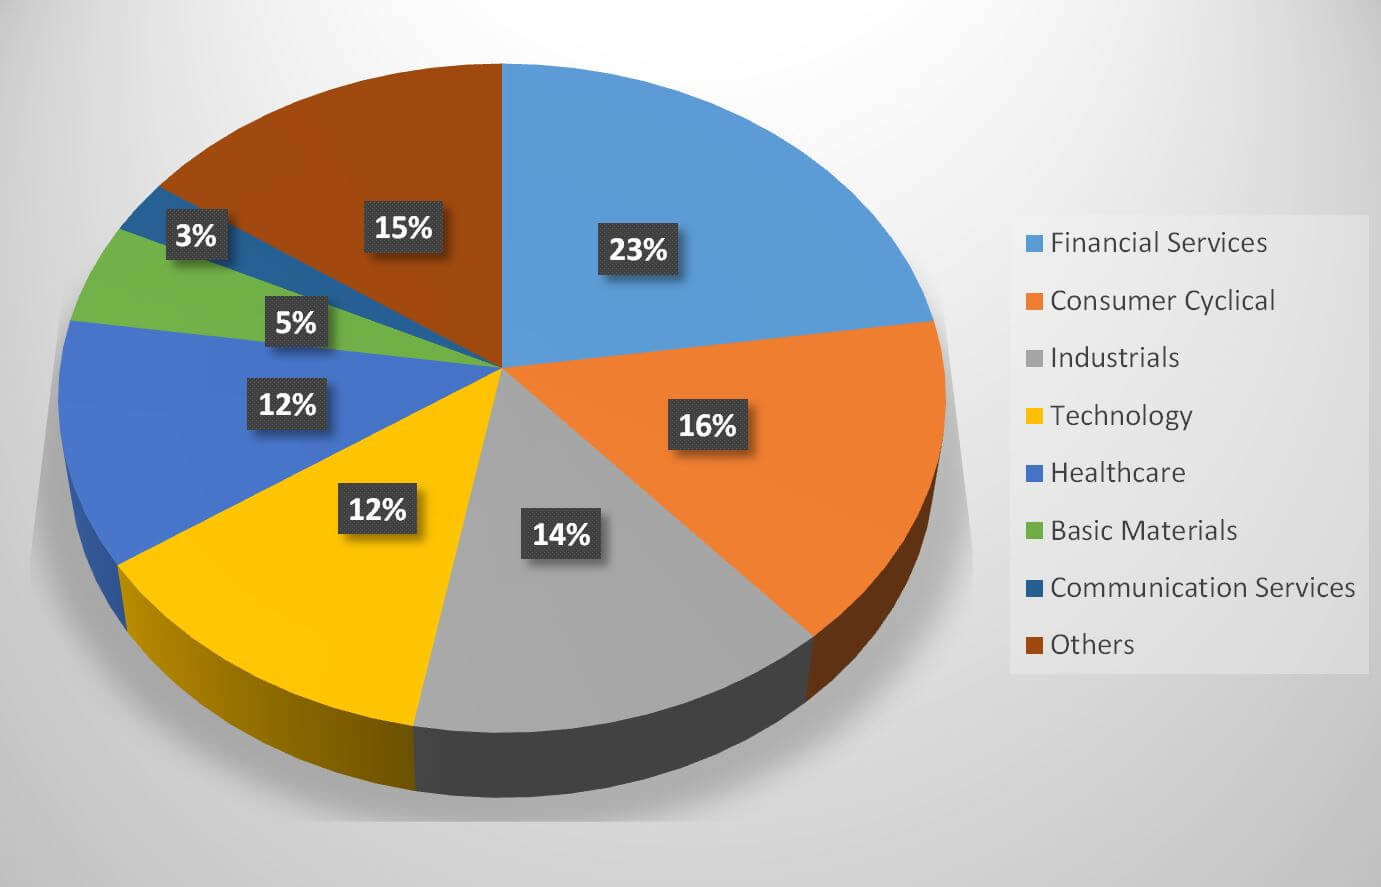
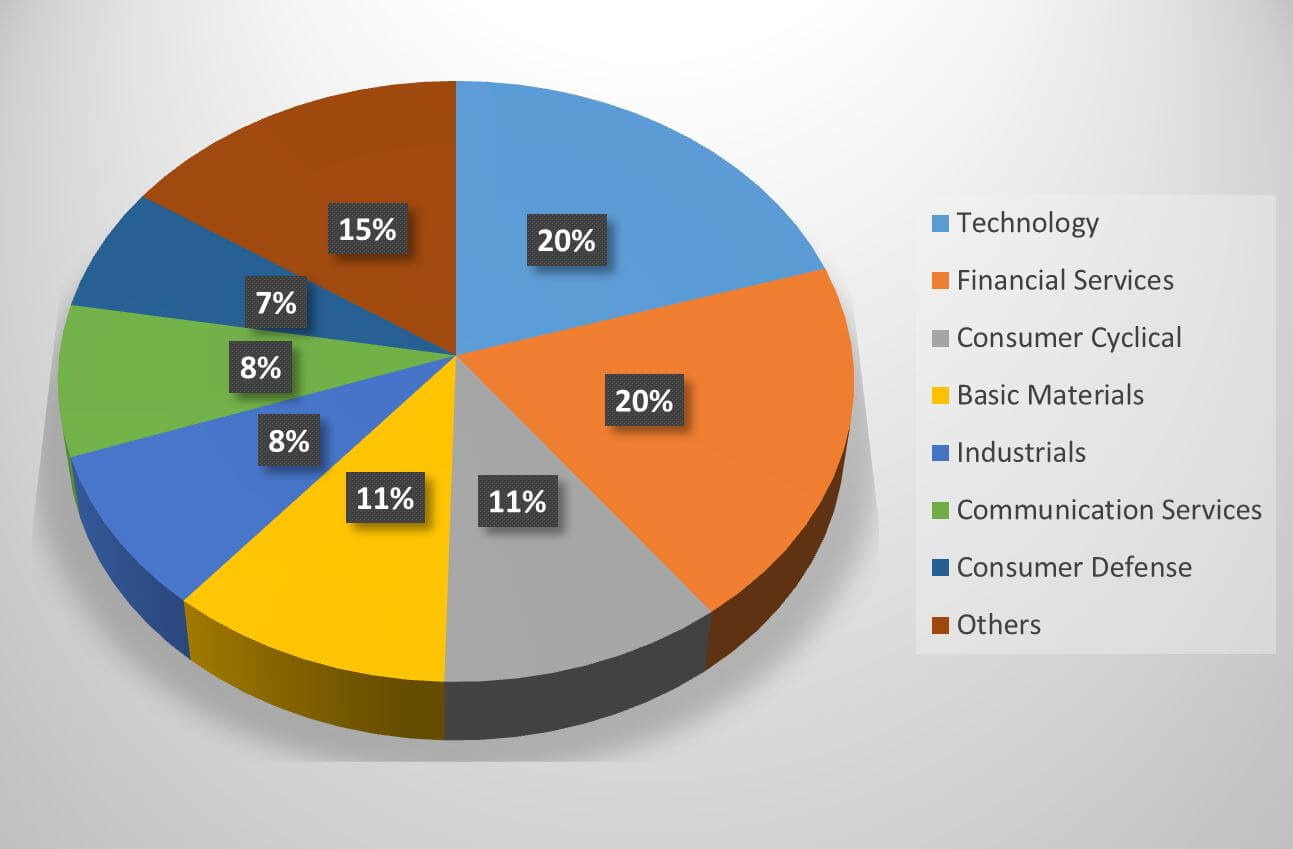
Portfolio Composition:
Top Holdings:
|
Apple Inc |
4.17% |
|
Microsoft Corp |
4.15% |
|
Amazon |
2.40% |
|
Alphabet Inc. Class C |
1.52% |
|
Alphabet Inc. Class A |
1.50% |
|
Procter & Gamble Co |
1.43% |
|
Intel Corp |
1.31% |
|
Verizon Communications Inc |
1.26% |
|
Merck & Co Inc |
1.21% |
|
The Home Depot Inc |
1.14% |
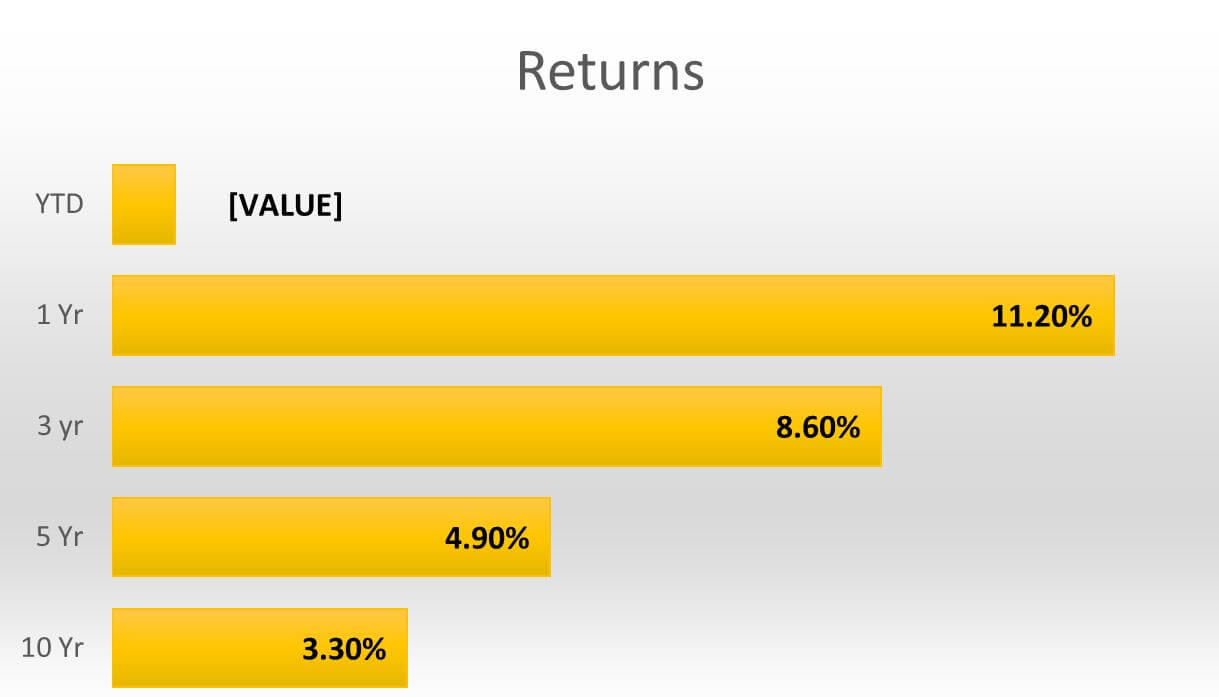
Performance:
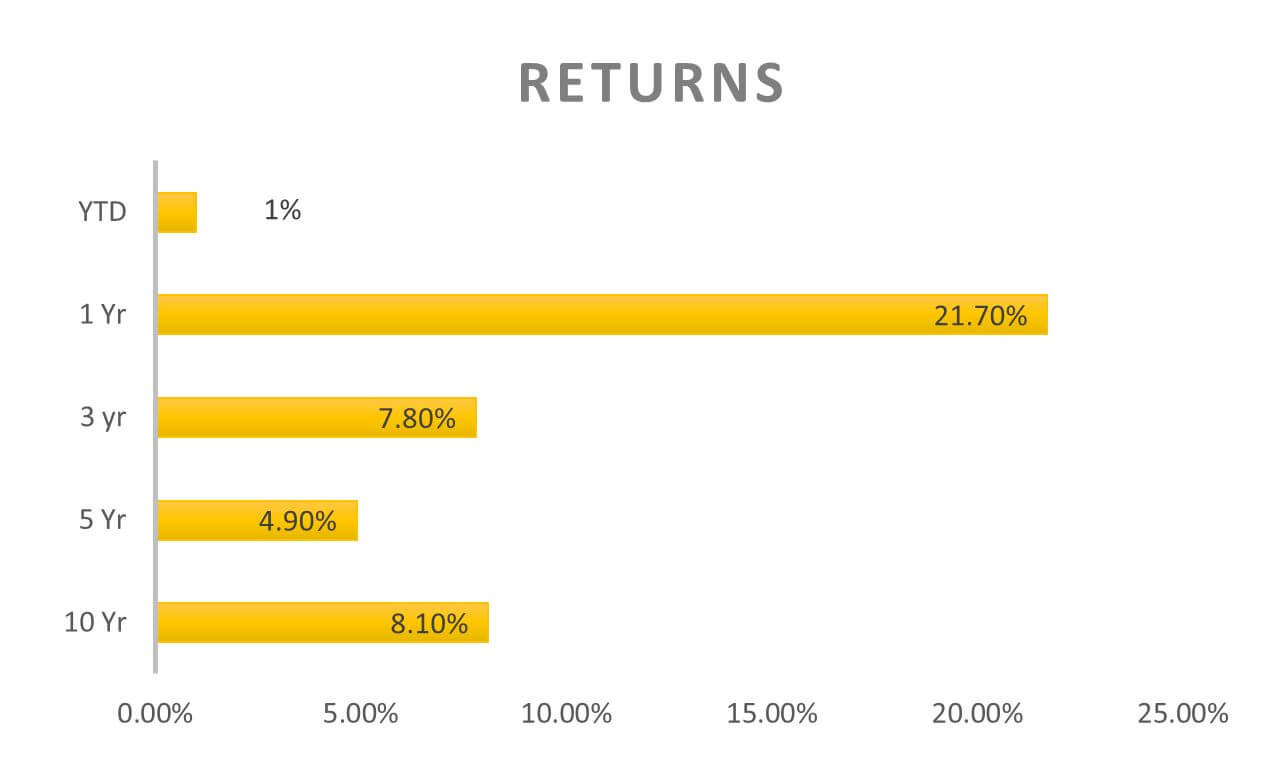
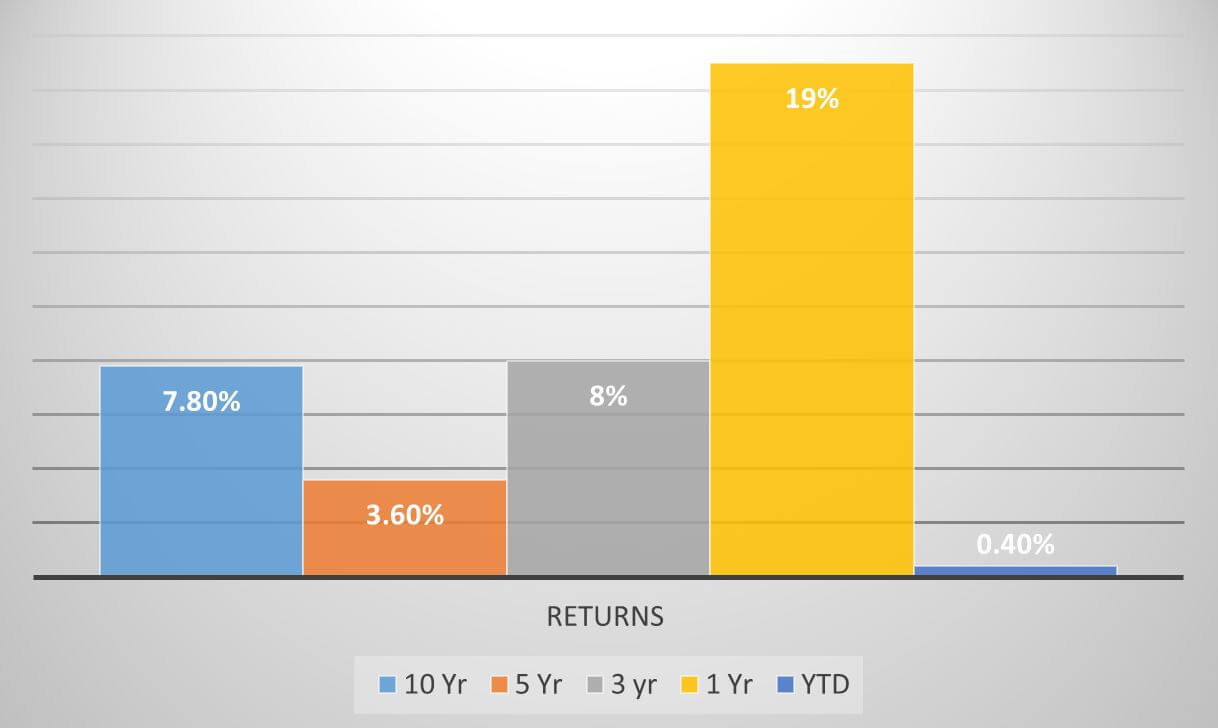
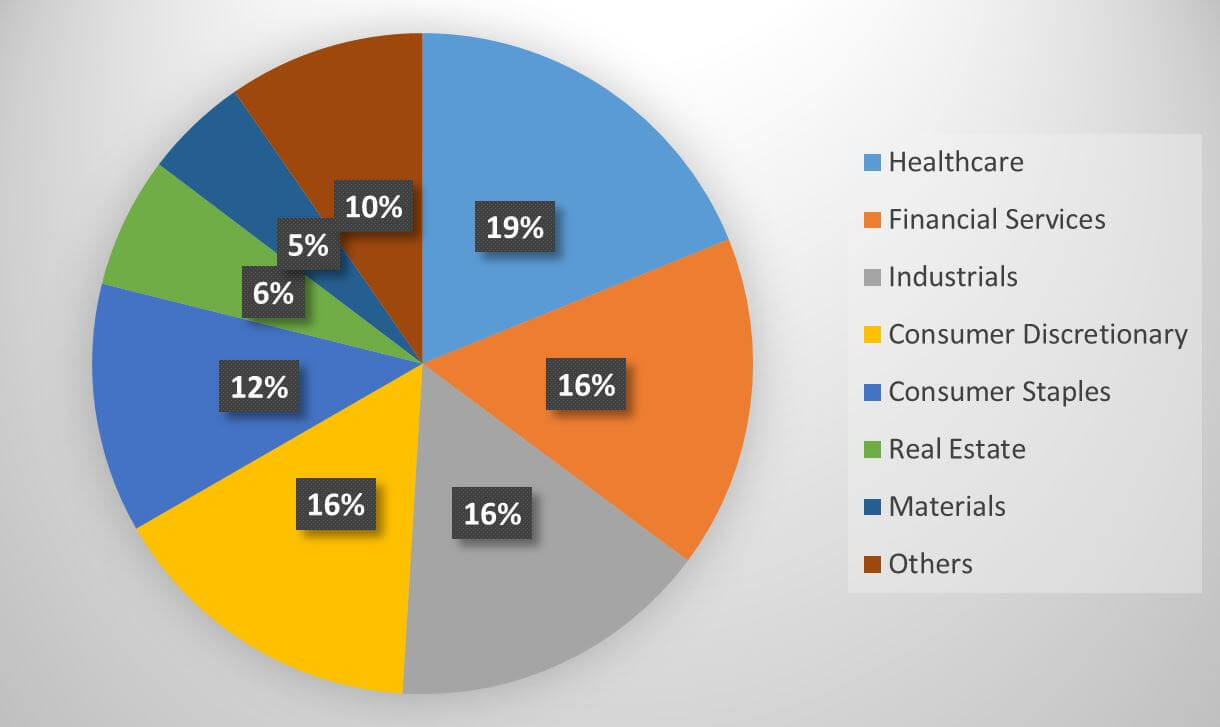
Vanguard Global ESG Select Stock Fund (VESGX)
VESGX invests in global large- and mid-cap stocks that report a higher level of growth and come under the norms of ESG. The portfolio comprises of 40-50 global ESG stocks. This fund invests 47% in the US stocks and the rest in the global shares.
Profile:
|
Asset Class |
Global Equity (Large Cap Equity) |
|
Fund Type |
Open End |
|
Inception Date |
4-Jan-19 |
|
Total Net Asser ($ Million) |
88.6 |
|
Expense Ratio (%) |
0.45 |
|
YTD Return (%) |
0.4 |
|
Net Asset In Top 10 ($ Million) |
26.2 |
|
Holdings in Top 10 (%) |
35 |
|
Benchmark |
FTSE All-World Index |
Portfolio Composition:
Top Holdings:
|
Microsoft Corp |
4.1% |
|
Merck & Co Inc |
4.0% |
|
Deere & Co |
4.0% |
|
Novartis AG |
3.7% |
|
The Home Depot Inc |
3.6% |
|
Texas Instruments Inc |
3.5% |
|
Starbucks Corp |
3.2% |
|
Bank of Nova Scotia |
3.1% |
|
Taiwan Semiconductor Manufacturing Co. Ltd. |
2.9% |
|
Northern Trust Corp |
2.9% |
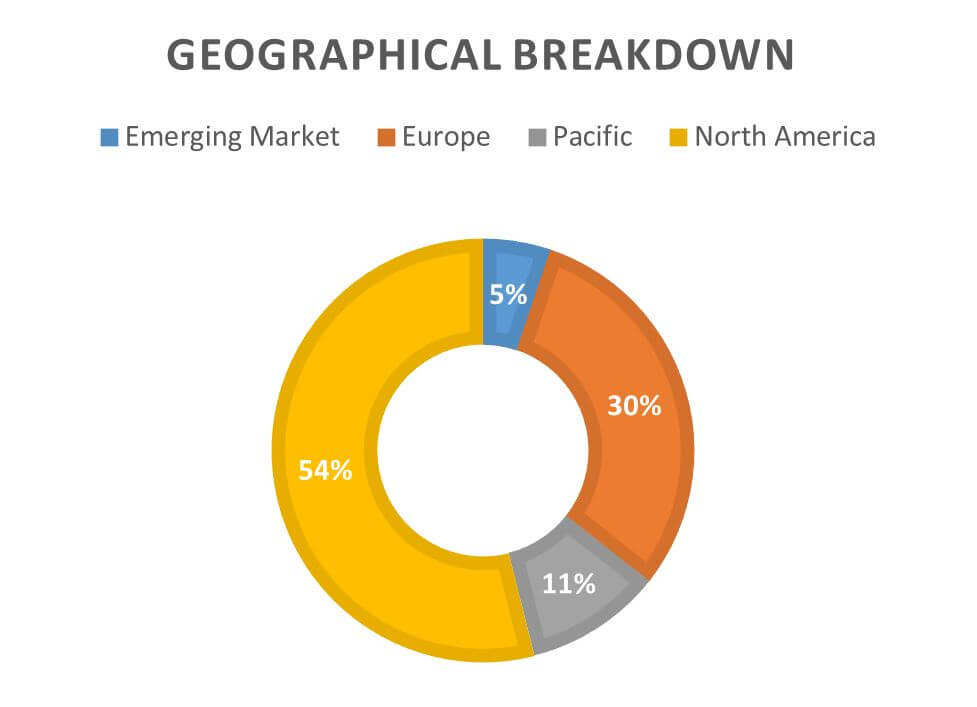
Geographical Composition:
TIAA-CREF Social Choice Bond Funds (TSBIX)
TSBIX invests 80% of its assets in bonds while giving special considerations to ESG criteria. The portfolio of TSBIX primarily includes a broad range of investment-grade bonds and fixed-income securities.
Profile:
|
Asset Class |
U.S. Investment-Grade Bonds |
|
Fund Type |
Open End |
|
Inception Date |
21 Sep.2012 |
|
Total Net Asser ($ Billion) |
4.68 |
|
Expense Ratio (%) |
0.37 |
|
YTD Return (%) |
0.6 |
|
Net Asset In Top 10 ($ Million) |
301 |
|
Holdings in Top 10 (%) |
6.7 |
|
Benchmark |
Bloomberg Barclays US Aggregate Bond TR USD |
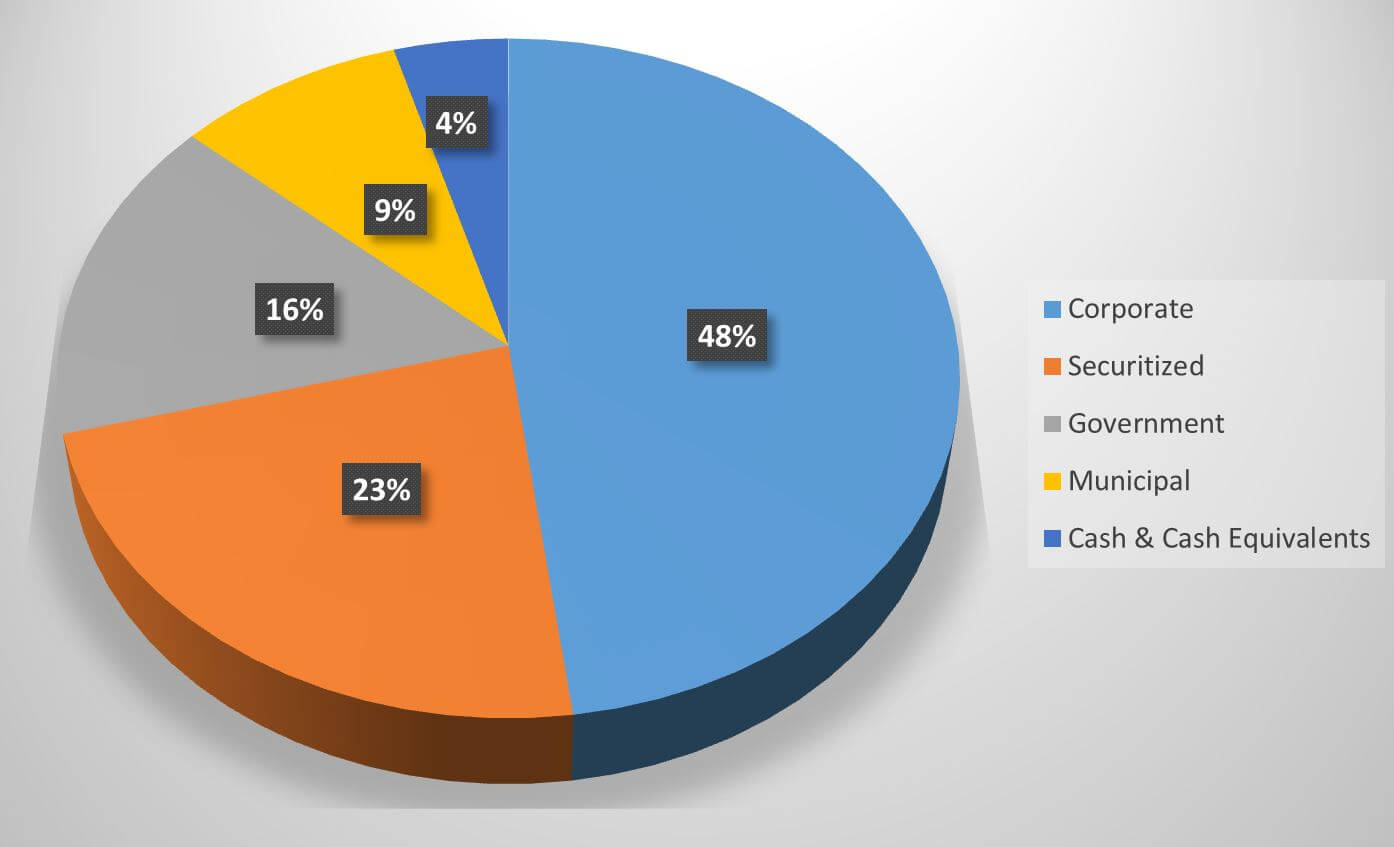
Portfolio Composition:
Top Holdings:
|
U.S. Treasury Bonds 2.25% |
1.38% |
|
U.S. Treasury Notes 1.88% |
0.76% |
|
U.S. Treasury Notes 1.62% |
0.71% |
|
Federal National Mortgage Association 3% |
0.64% |
|
U.S. Treasury Notes 1.62% |
0.56% |
|
U.S. Treasury Notes 1.62% |
0.54% |
|
Unilever Capital Corporation 2% |
0.54% |
|
International Business Machines Corporation 2.3% |
0.50% |
|
CHICAGO ILL MET WTR RECLAMATION DIST GTR CHICAGO 5.72% |
0.48% |
|
U.S. Treasury Notes 0.5% |
0.45% |
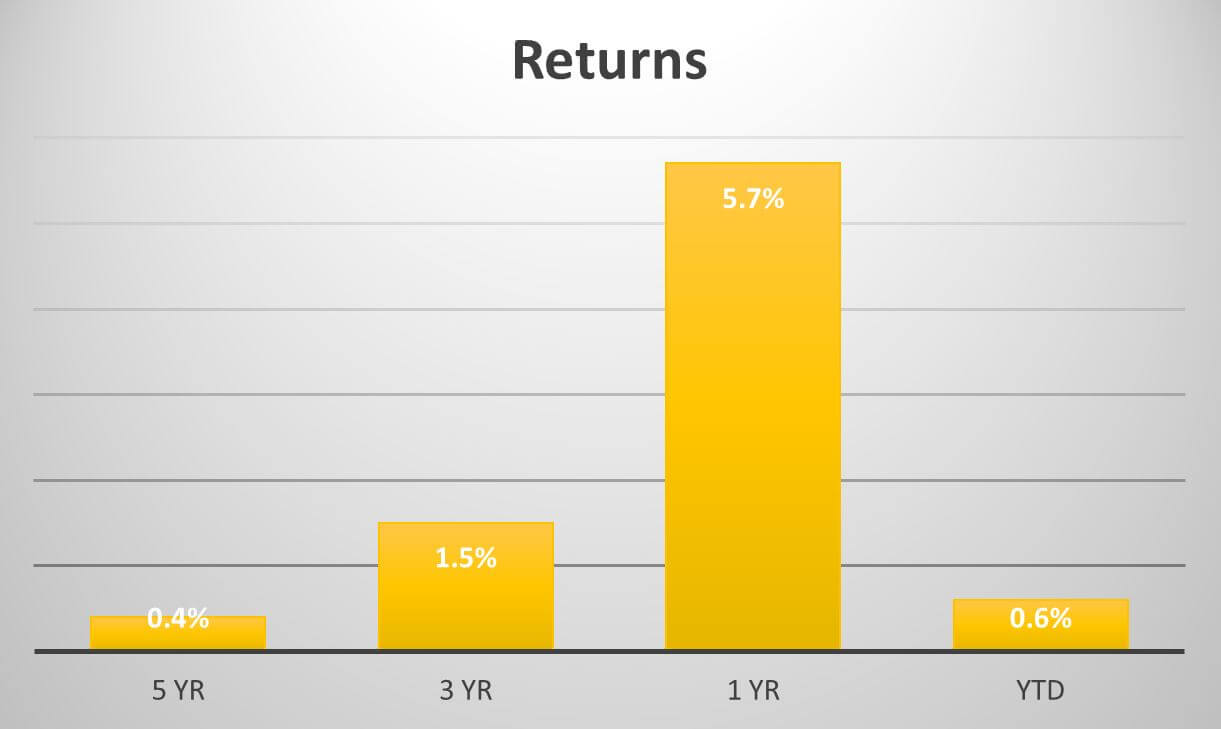
Performance:
DFA Emerging Markets Social Core Portfolio (DFESX)
DFESX invests 80% of its assets in the emerging markets equities that are defined as Approved Market Securities. The investment objective of this fund is to generate long-term capital gains.
Profile:
|
Asset Class |
Emerging Market Equity |
|
Fund Type |
Open End |
|
Inception Date |
31 Aug. 2006 |
|
Total Net Asser ($ Billion) |
1.57 |
|
Expense Ratio (%) |
0.53 |
|
YTD Return (%) |
0.7 |
|
Net Asset In Top 10 ($ Million) |
229 |
|
Holdings in Top 10 (%) |
17.36 |
|
Benchmark |
MSCI Emerging Market Index |
Portfolio Composition:
Top Holdings:
|
Samsung Electronics Co. Ltd. |
4.43% |
|
Taiwan Semiconductor |
3.73% |
|
Tencent Holdings Ltd. |
2.03% |
|
Petroleo Brasileiro SA |
1.62% |
|
Vale SA |
1.18% |
|
SK Hynix Inc |
1.11% |
|
Infosys |
0.91% |
|
Alibaba Group Holdings Ltd. |
0.84% |
|
Ping An Insurance Group Co of China Ltd. Class H |
0.76% |
|
China Mobile Ltd. |
0.75% |
Performance:
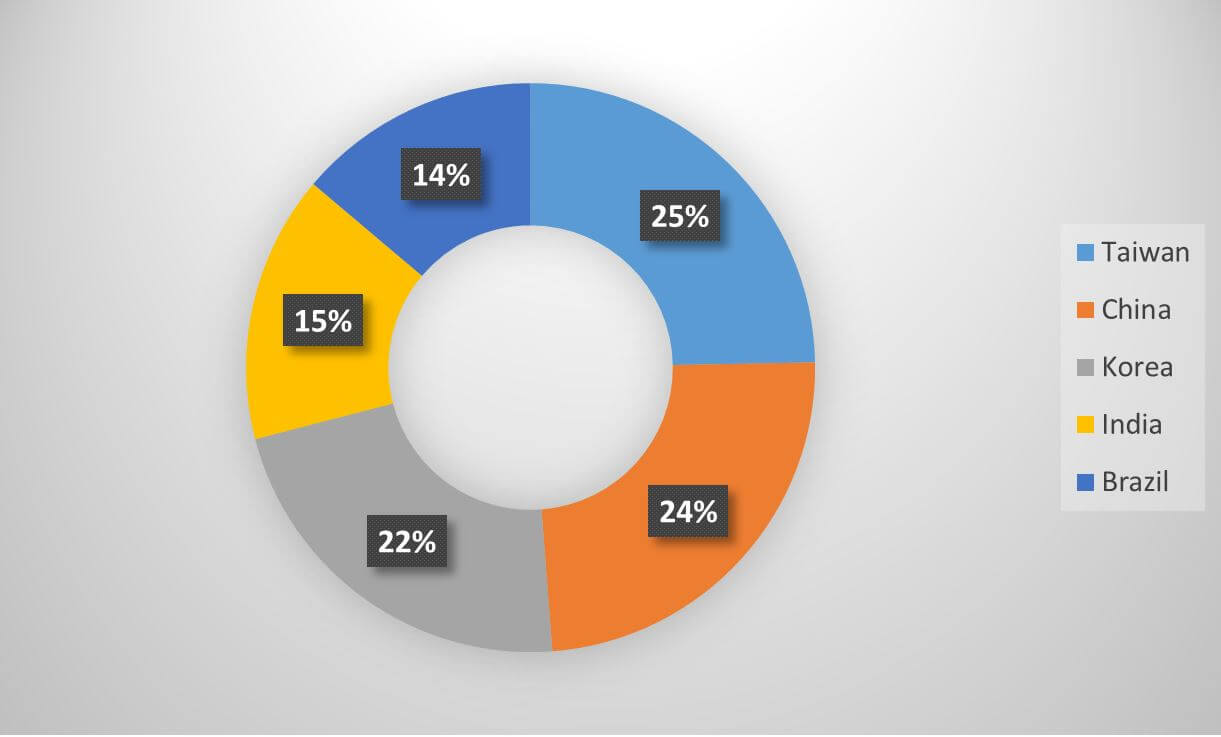
Geographical Composition:
PAX ESG Beta Quality Fund (PXWGX)
PXWGX invests in US large-cap companies with influential ESG factors. The portfolio of PAWGX comprises of companies with high profitability, higher earnings, less risky, and lower valuation in comparison to the market.
Profile:
|
Asset Class |
U.S. Large-Cap Blend Equity |
|
Fund Type |
Open End |
|
Inception Date |
11-Jun-97 |
|
Total Net Asser ($ Million) |
240 |
|
Expense Ratio (%) |
0.9 |
|
YTD Return (%) |
0.4 |
|
Net Asset In Top 10 ($ Million) |
62.7 |
|
Holdings in Top 10 (%) |
27.63 |
|
Benchmark |
Russell 1000 Index |
Portfolio Composition:
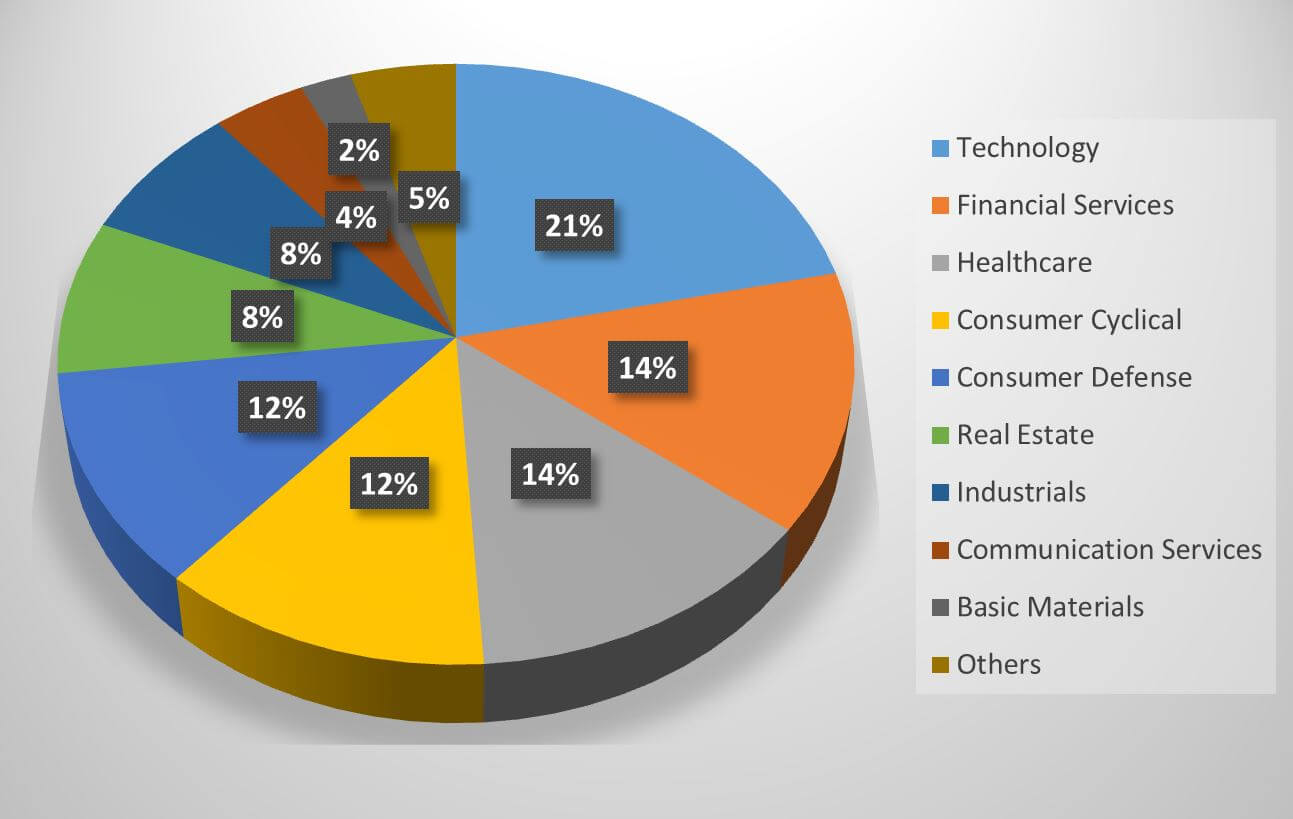
Top 10 Holdings:
|
Apple Inc |
3.23% |
|
Microsoft Corp |
3.23% |
|
Service Properties Trust |
2.89% |
|
Amazon |
2.74% |
|
Pepsi Co Inc |
2.73% |
|
Verizon Communications Inc |
2.72% |
|
Mastercard Inc A |
2.70% |
|
Texas Instruments Inc |
2.60% |
|
Alphabet Inc A |
2.40% |
|
Johnson & Johnson |
2.38% |
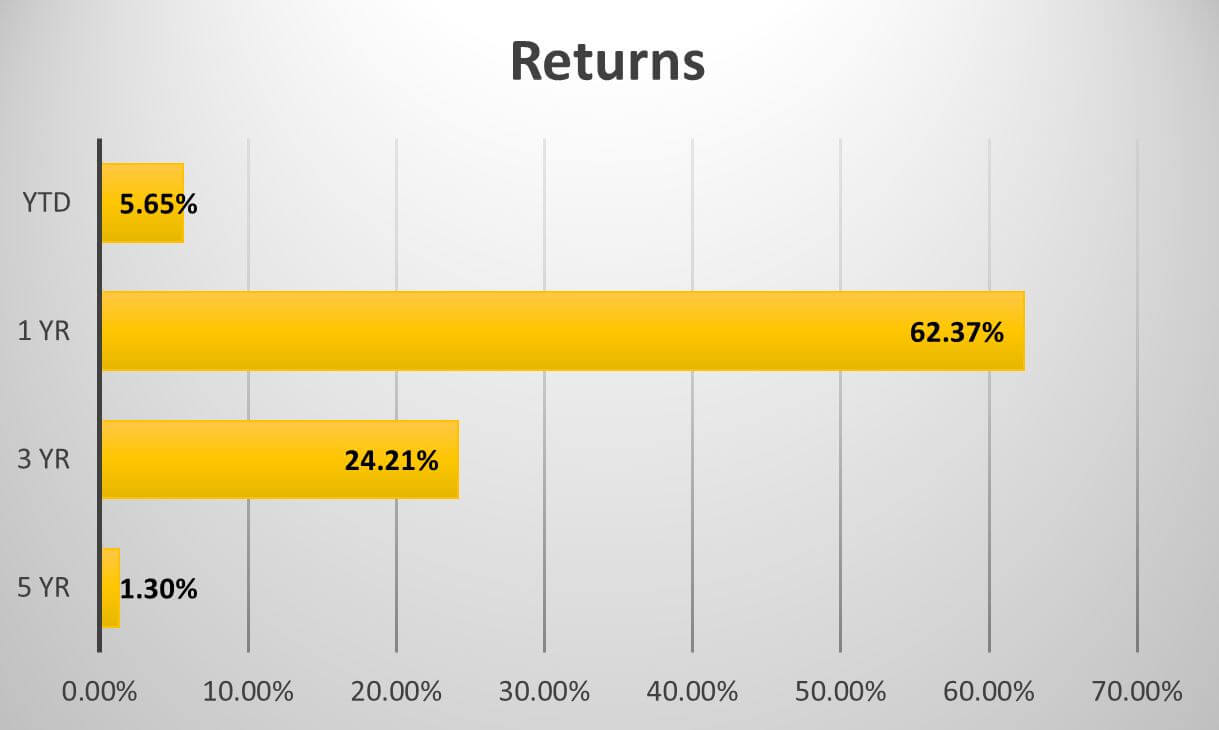
Performance:
Top ESG ETFs
Below are the top ESG ETFs -
- iShares MSCI KLD 400 Social ETF (DSI)
- iShares ESG MSCI USA Leaders ETF (SUSL)
- Xtrackers MSCI U.S.A. ESG Leader Equity ETF (USSG)
- Vanguard ESG U.S. Stock ETF (ESGV)
- Invesco Solar ETF (TAN)
iShares MSCI KLD 400 Social ETF (DSI)
DSI invests in socially responsible U.S. companies and tracks a market-cap-weighted index of 400 companies that have positive environmental, social, and governance characteristics.
DSI excludes the firms that are involved in the businesses of nuclear energy, genetic modification, weapon manufacturing, etc.
DSI also avoids making huge sector bets, so it avoids names like Apple, Exxon, AT&T. This ETF holds moderate liquidity, consistent volume, and significant spread.
|
Asset Class |
Equity |
|
Fund Type |
Open End |
|
Inception Date |
14-Nov-06 |
|
Weighted Average Market Cap. ($ Billion) |
242.18 |
|
Expense Ratio (%) |
0.25 |
|
Benchmark |
MSCI KLD 400 Social Index |
|
P/E Ratio (x) |
25.57 |
|
P/B Ratio (x) |
4.37 |
|
Distribution Yield (%) |
1.39 |
Portfolio Composition:
Top 10 Holdings:
|
Microsoft Corp |
8.10% |
|
Facebook Class A |
3.63% |
|
Alphabet Class C |
3.09% |
|
Alphabet Class A |
2.96% |
|
Visa Class A |
2.32% |
|
Procter & Gamble |
2.15% |
|
Mastercard Inc Class A |
1.94% |
|
Intel Corporation |
1.81% |
|
Walt Disney |
1.80% |
|
Home Depot Inc |
1.70% |
Performance:
iShares ESG MSCI USA Leaders ETF (SUSL)
SUSL tracks MSCI USA Extended ESG Leaders Index. This index gives SUSL the access to invest in large- and mid-cap U.S. stocks with the highest ESG rating and, at the same time, it excludes those with low ESG ratings and severe controversies.
Profile:
|
Asset Class |
Equity |
|
Fund Type |
Open End |
|
Inception Date |
7-May-19 |
|
Weighted Average Market Cap. ($ Billion) |
238.41 |
|
Expense Ratio (%) |
0.1 |
|
Benchmark |
MSCI USA Extended ESG Leaders Index |
|
P/E Ratio (x) |
23.96 |
|
P/B Ratio (x) |
4.3 |
Portfolio Composition:
Top 10 Holdings:
|
Microsoft Corp |
8.26% |
|
Alphabet Class A |
3.15% |
|
Alphabet Class C |
3.02% |
|
Johnson & Johnson |
2.70% |
|
Visa Class A |
2.36% |
|
Procter & Gamble |
2.19% |
|
Mastercard Inc Class A |
1.98% |
|
Intel Corporation |
1.84% |
|
Walt Disney |
1.84% |
|
Home Depot Inc |
1.73% |
Xtrackers MSCI U.S.A. ESG Leader Equity ETF (USSG)
Xtrackers MSCI U.S.A. ESG Leader Equity ETF tracks the MSCI USA ESG leader index, which allows it to invest in US large- and mid-cap stocks with high ESG performance. At the same time, it excludes the companies of specific controversial industries like tobacco, alcohol, gambling, controversial weapon, etc.
USSG also avoids investing in the shares of those companies that have a low MSCI rating. A low fee and reasonable strategy helped this fund to gain popularity in no time among socially responsible investors.
Profile:
|
Asset Class |
Equity |
|
Fund Type |
Open End |
|
Inception Date |
7-Mar-19 |
|
Weighted Average Market Cap. ($ Billion) |
238.45 |
|
Expense Ratio (%) |
0.1 |
|
Benchmark |
MSCI USA ESG Leaders Index |
|
P/E Ratio (x) |
24.92 |
|
P/B Ratio (x) |
4.26 |
Portfolio Composition:
Top 10 Holdings:
|
Microsoft Corp |
8.24% |
|
Alphabet Class C |
3.12% |
|
Alphabet Class A |
3.00% |
|
Johnson & Johnson |
2.71% |
|
Visa Class A |
2.35% |
|
Procter & Gamble |
2.18% |
|
Mastercard Inc Class A |
1.95% |
|
Walt Disney |
1.86% |
|
Intel Corporation |
1.85% |
|
Verizon Communication |
1.75% |
Vanguard ESG U.S. Stock ETF (ESGV)
Vanguard ESG U.S. Stock ETF tracks the FTSE US All Cap Choice Index. It shows that ESGV invests in the shares of large-, mid- as well as small-cap companies that are screened for specific ESG criteria.
It excludes companies in sectors like fossil fuel, nuclear energy, weapons, tobacco, and alcohol. Even it excludes those companies that don't meet the standards of U.N. global impact principles, as well as those that don't meet labor rights, human rights, and anti-corruption criteria. ESGV is a passively managed fund.
Profile:
|
Asset Class |
Equity |
|
Fund Type |
Open End |
|
Inception Date |
18-Sep-18 |
|
Weighted Average Market Cap. ($ Billion) |
247.51 |
|
Expense Ratio (%) |
0.12 |
|
Benchmark |
FTSE US All Cap Choice Index |
|
P/E Ratio (x) |
26.64 |
|
P/B Ratio (x) |
3.58 |
|
Distribution Yield (%) |
1.26 |
Portfolio Composition:
Top 10 Holdings:
|
Apple Inc |
4.73% |
|
Microsoft Corp |
4.48% |
|
Amazon |
2.91% |
|
Facebook Inc Class A |
1.88% |
|
JP Morgan Chase & Co. |
1.64% |
|
Alphabet Inc Class C |
1.55% |
|
Alphabet Inc Class A |
1.53% |
|
Visa Inc Class A |
1.26% |
|
Procter & Gamble Co |
1.18% |
|
Bank of America Corp |
1.10% |
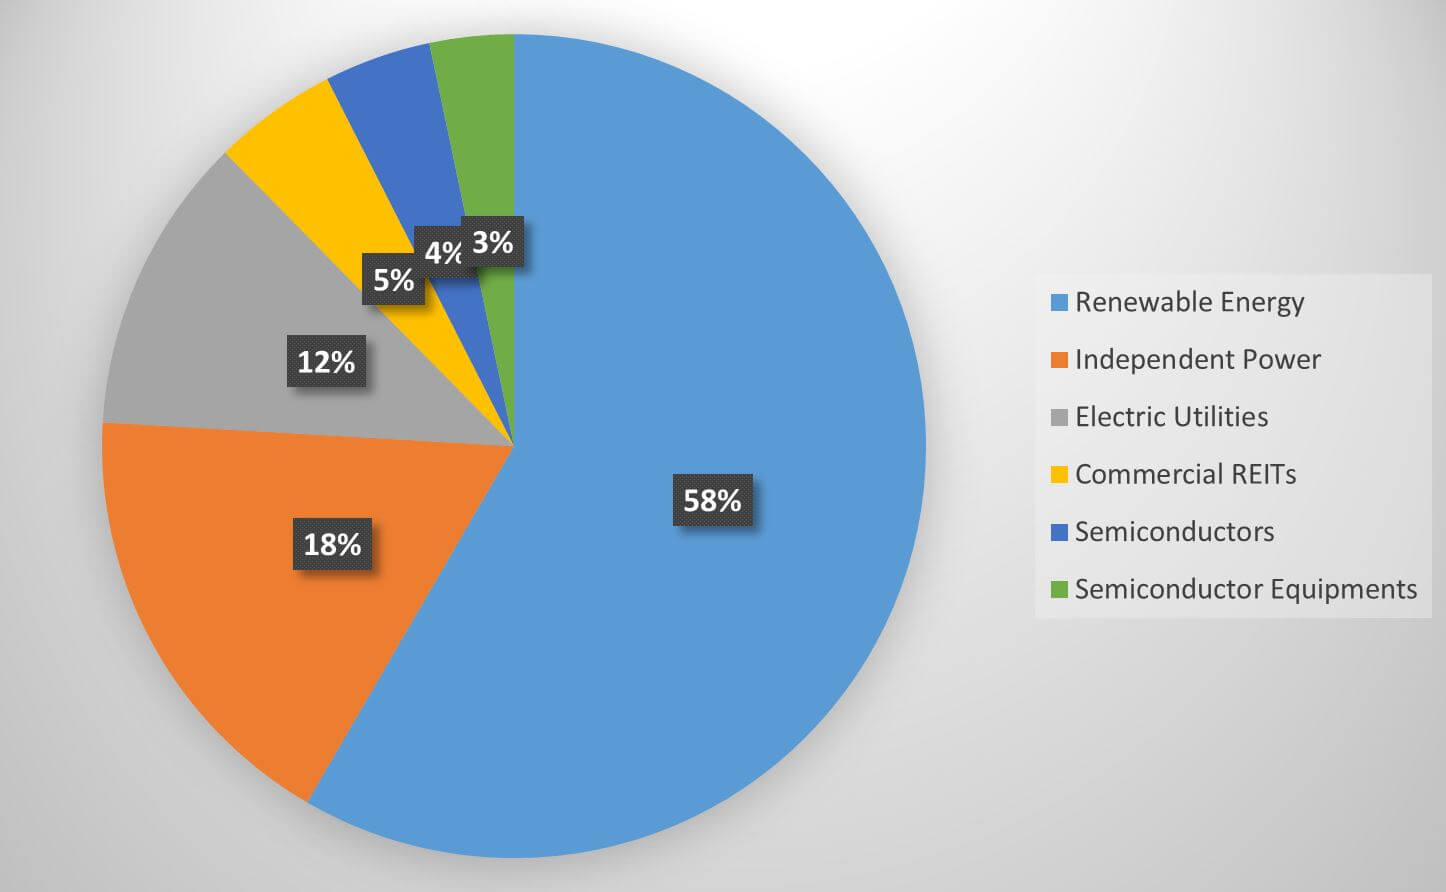
Invesco Solar ETF (TAN)
Invesco Solar ETF tracks the MAC Global Solar Index that comprises of the companies in the solar energy industry. TAN invests 90% of its assets in the securities, American Depository Receipts (ADR) and Global Depository Receipts (GDR).
Profile:
|
Asset Class |
Equity |
|
Fund Type |
Open End |
|
Inception Date |
15-Apr-08 |
|
Weighted Average Market Cap. ($ Billion) |
2.39 |
|
Expense Ratio (%) |
0.71 |
|
Benchmark |
MAC Global Solar Energy |
|
P/E Ratio (x) |
45.25 |
|
P/B Ratio (x) |
1.63 |
|
Distribution Yield (%) |
0.28 |
Top Sectors:
Top 10 Holdings:
|
SolarEdge Technologies |
10.22% |
|
First Solar Inc |
8.74% |
|
Enphase Energy Inc |
7.59% |
|
Xinyi Solar Holdings Ltd |
7.04% |
|
Scatec Solar ASA |
5.64% |
|
Sunrun Inc |
5.28% |
|
Canadian Solar Inc |
4.43% |
|
Hannon Armstrong Sustainable Infra. Cap. Nc. |
4.28% |
|
Encavis AG |
4.26% |
|
GCL-Poly Energy Holdings Ltd. |
4.20% |
Performance: